Bard allows you to quickly find out why users aren't interacting with your application the way you'd expect.
Key Features
What do we offer?
TEST THE SCREEN WIDTH
About Bard
Case Study
-
1. Introduction
-
Problem Definition
-
Possible Solutions
-
What is Session Replay?
-
Existing Session Replay Solutions
-
2. What is Bard?
-
Replaying Sessions
-
Conversion Analysis
-
3. Architecture
-
Overview
-
Collection
-
Data Processing & Storage
-
Analyze & Replay
-
4. Design Decisions
-
Session Recording
-
Data Ingestion
-
5. Implementation Challenges
-
Sessions
-
Funnel Analysis
-
SQL Injections
-
Securing the Agent API
-
6. Installation & Deployment
-
Deploying Infrastructure
-
Instrumenting Your Application
-
7. Future Plans
1. Introduction
Problem Definition
Developers have a vested interest in the user experience of their applications. They put a lot of thought into the organization of the user interface, and how they believe users will interact with the site. These interactions include things like signing up for an email subscription, adding items to a cart, or filling out forms. But when an application is launched, users don`t always interact with it as expected; they may experience difficulty doing things the developers intended to be simple. This can be a major issue because application owners have limited insight into their user`s problems. Therefore, they have a limited ability to adjust the application to help users complete key activities.
What is User Conversion?
User conversions and conversion paths are an important part of any application. A conversion is an action on a website that developers want users to complete. Some examples could be watching video content, buying a product, or interacting on a message board. A conversion path is a series of step-by-step actions the user must complete to convert. These conversions are the key moments for application users; they decide if the user`s visit to the website was a success or a failure. Therefore, if an application has a low rate of user conversion, it's important to find out where and why users are straying from the conversion path.
The problem is that there are all sorts of reasons why a user might be having trouble on a website; maybe they ran into an error when they submitted a form, maybe the website crashed, maybe a page took too long to load and they just gave up and left, the list goes on. To find out why conversion rates are low, it's important to have a tool flexible enough to identify each of the possible root causes; no small feat given the volume of things that could go wrong.
Possible Solutions
There are many possible solutions that help developers investigate low user conversion rates. One of these is collecting and analyzing application metrics. These metrics can include site traffic, top-viewed pages, and even the rate of conversion. Metrics are excellent tools for gathering high-level information about a website`s performance, but they lack meaningful information about individual user interactions; at best, they only offer a percentage of successful conversions. This is useful as a general health check, but it doesn`t give detailed information on a user`s interaction with the application. For example, metrics could tell you that your website has fast load times for all of your users, but they couldn`t tell you if 90% of your users don`t purchase your products because they can`t find the checkout button.
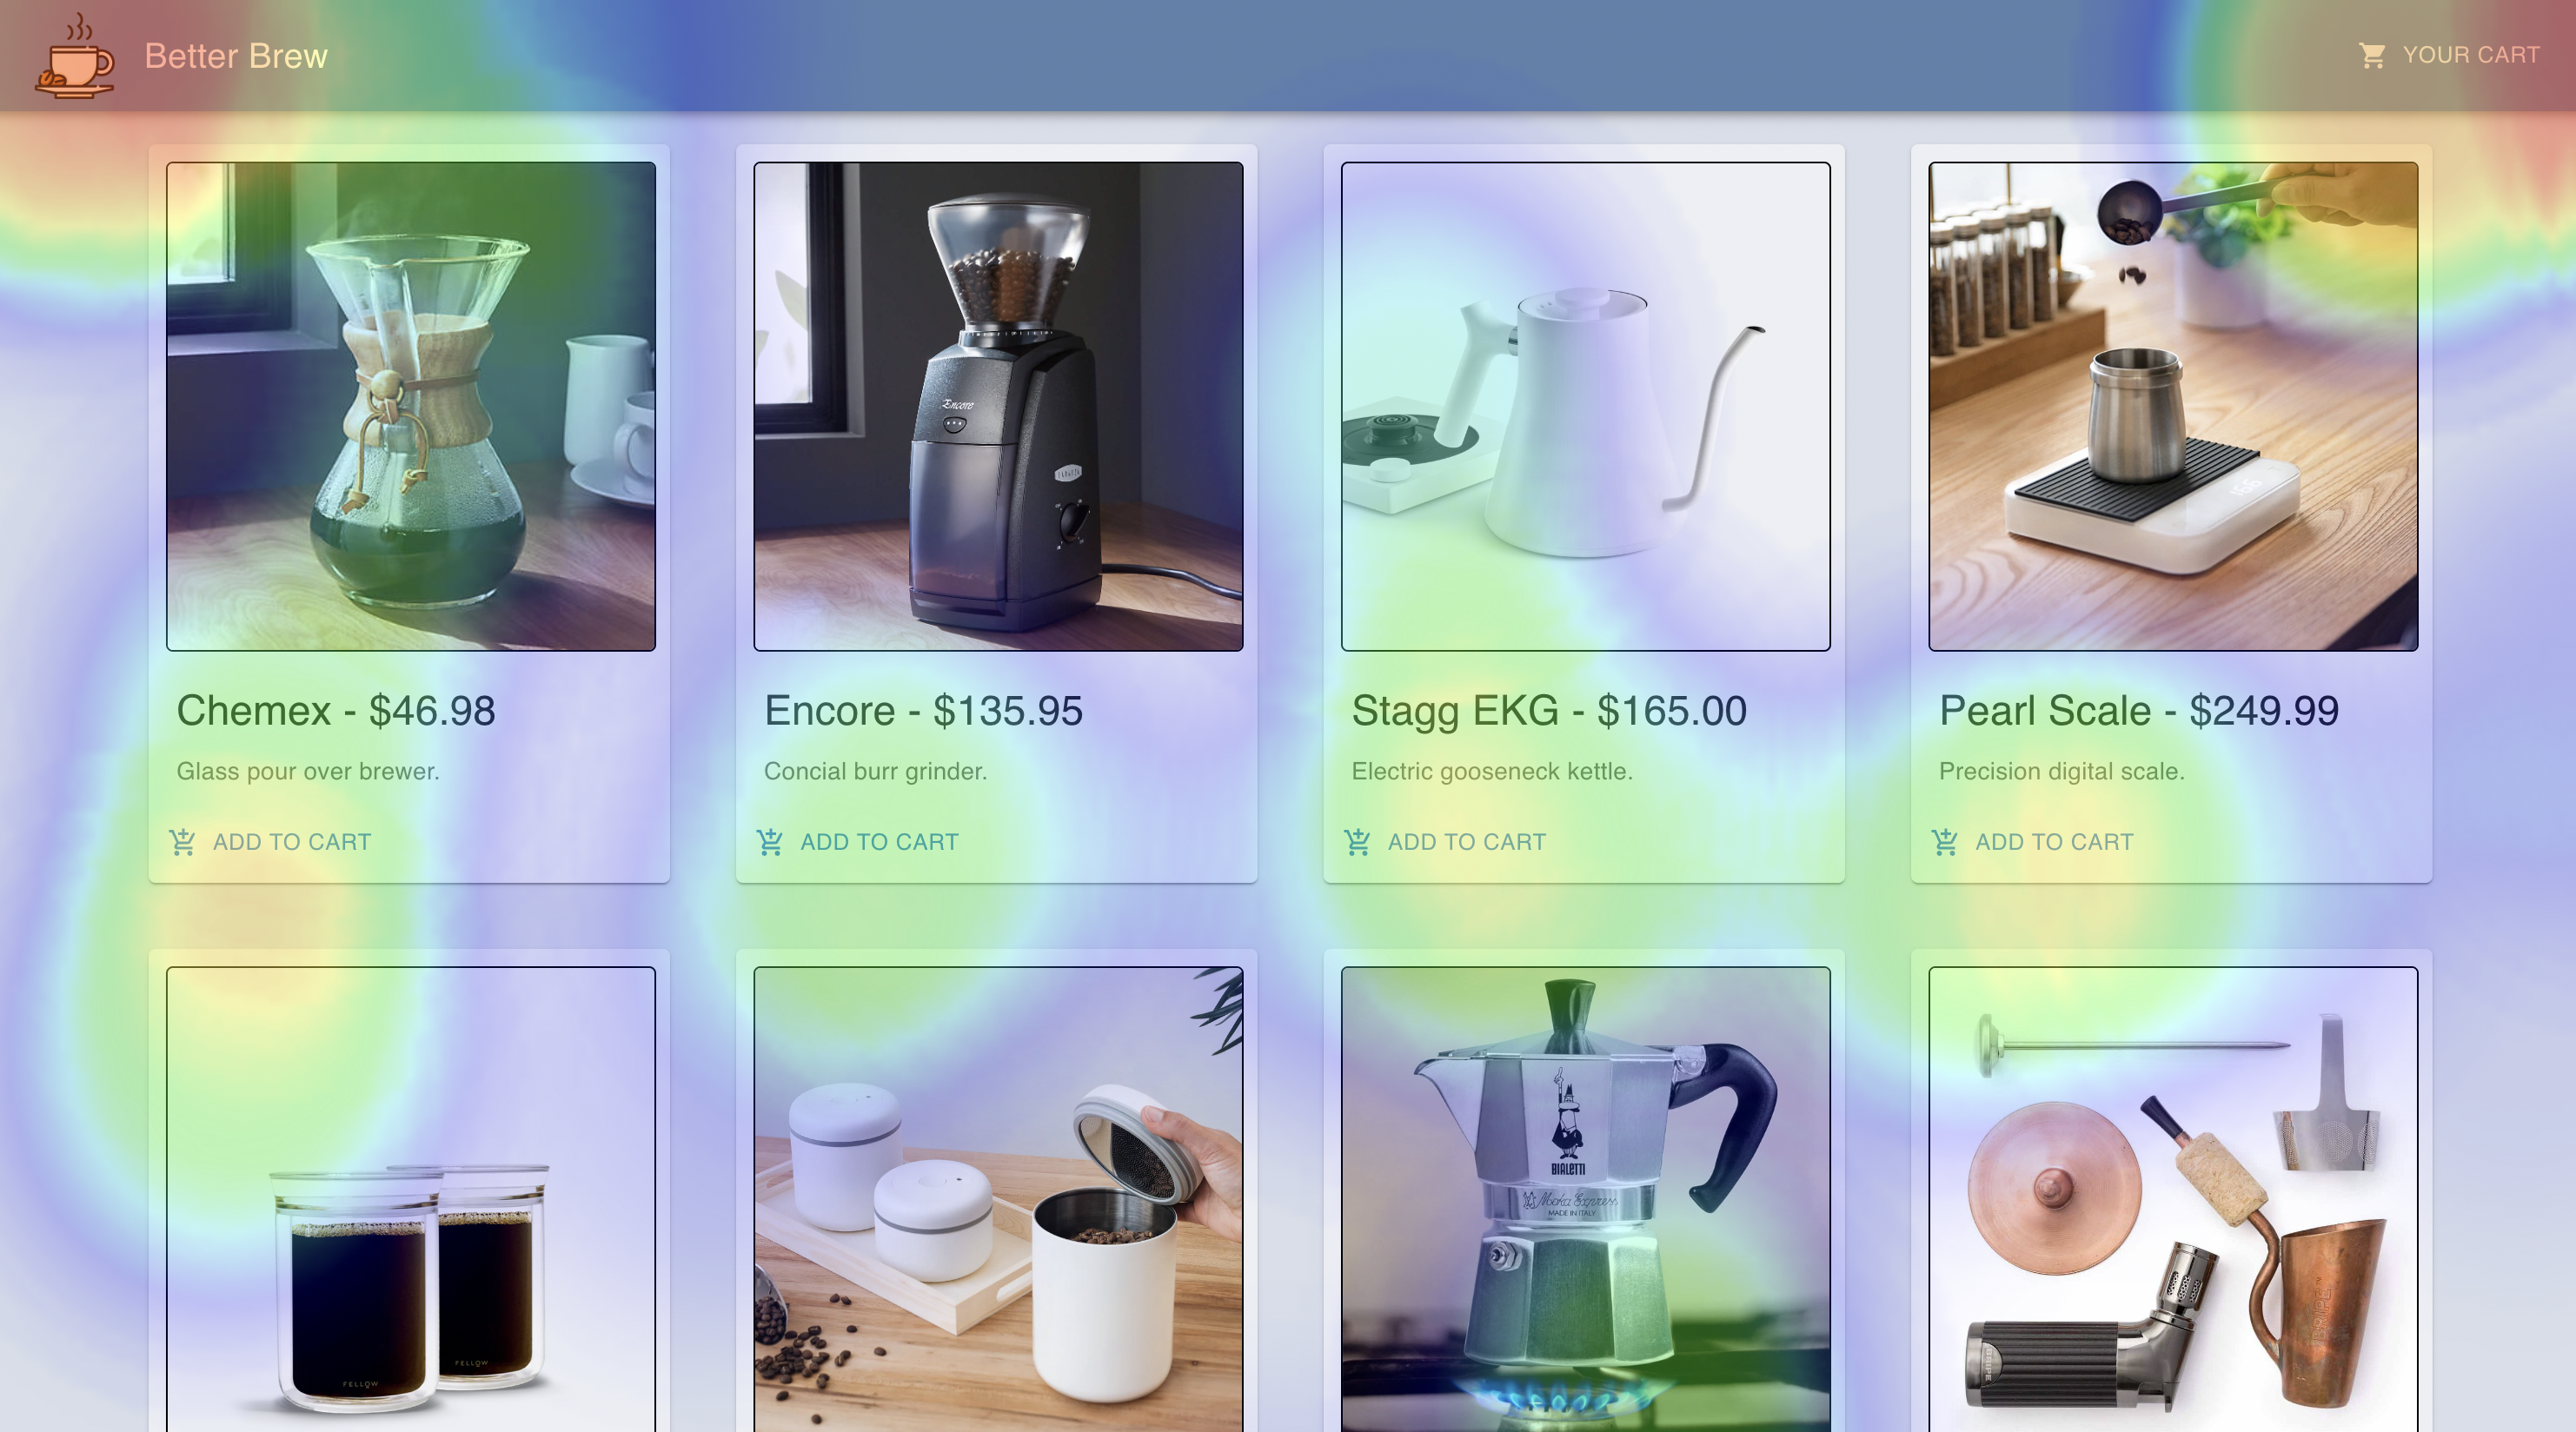
A solution that gives us more insight into individual user behavior is an application heat map. This is a visual that represents how often users click on each element on a website`s User Interface. It's a great tool to gain insight into where the user`s attention is, but it doesn`t show the full context of why users are, or are not, following the intended conversion path. For example, a heat map could tell a developer if app users aren`t clicking a button they should be clicking. But if the core problem is that a page takes too long to load and most app users quit before they can click anything, then the heat map won`t identify that issue.
Metrics and heat maps both provide imperfect solutions to the problem of low user conversion; metrics provide high-level quantitative information, while heat maps provide low-level, qualitative information. While combining heat maps and metrics may be a fair solution, it comes with the overhead of managing two different kinds of tools. Furthermore, heat maps may not provide the best form of qualitative information available; what if we`re interested in user actions other than clicks? What would be more powerful is the ability to watch a user as they interact with the application and investigate where and why users are leaving the conversion path. That`s where session replay tools come into play.
What is Session Replay?
Session replay tools provide a great way to analyze user conversions without the drawbacks discussed above. A web session is a series of contiguous actions taken by a user on a website within a given time frame. By using logged user events like mouse movements and clicks, session replay tools can reproduce a user`s session exactly how they experienced it. This allows developers to follow a session from beginning to end, giving the full context of what the user experienced and revealing why they may not have converted.
The major goal of session replay is understanding and improving a user`s experience. Most analytical tools like metric collection offer numeric data, but don`t show web page interactions from the eyes of the user. This is where session replay tools shine; they collect both qualitative and quantitative information about the user's experience. Developers can use a session replay tool to watch when a user leaves a conversion path, gaining insight into where the user gets frustrated and doesn`t convert. Additionally, session replay tools collect many of the same data points as heat maps and metrics. They can receive data on what users clicked, how long they spent on the website, and any errors that occurred, while also providing important context to this data via their replay functionality.
Despite these strengths, there are shortcomings to session replay tools. By itself, replaying user sessions is not a viable investigation method for large scale applications with thousands of daily users. That`s why most session replay tools use the data they collect to offer conversion analysis. This allows app developers to define explicit conversion paths and analyze each session to tell where a user left the path. It's a powerful tool that synthesizes the qualitative and quantitative data collected by session replay in a useful way.
Existing Session Replay Solutions
There are many session replay tools on the market today, so developers have plenty of choices.
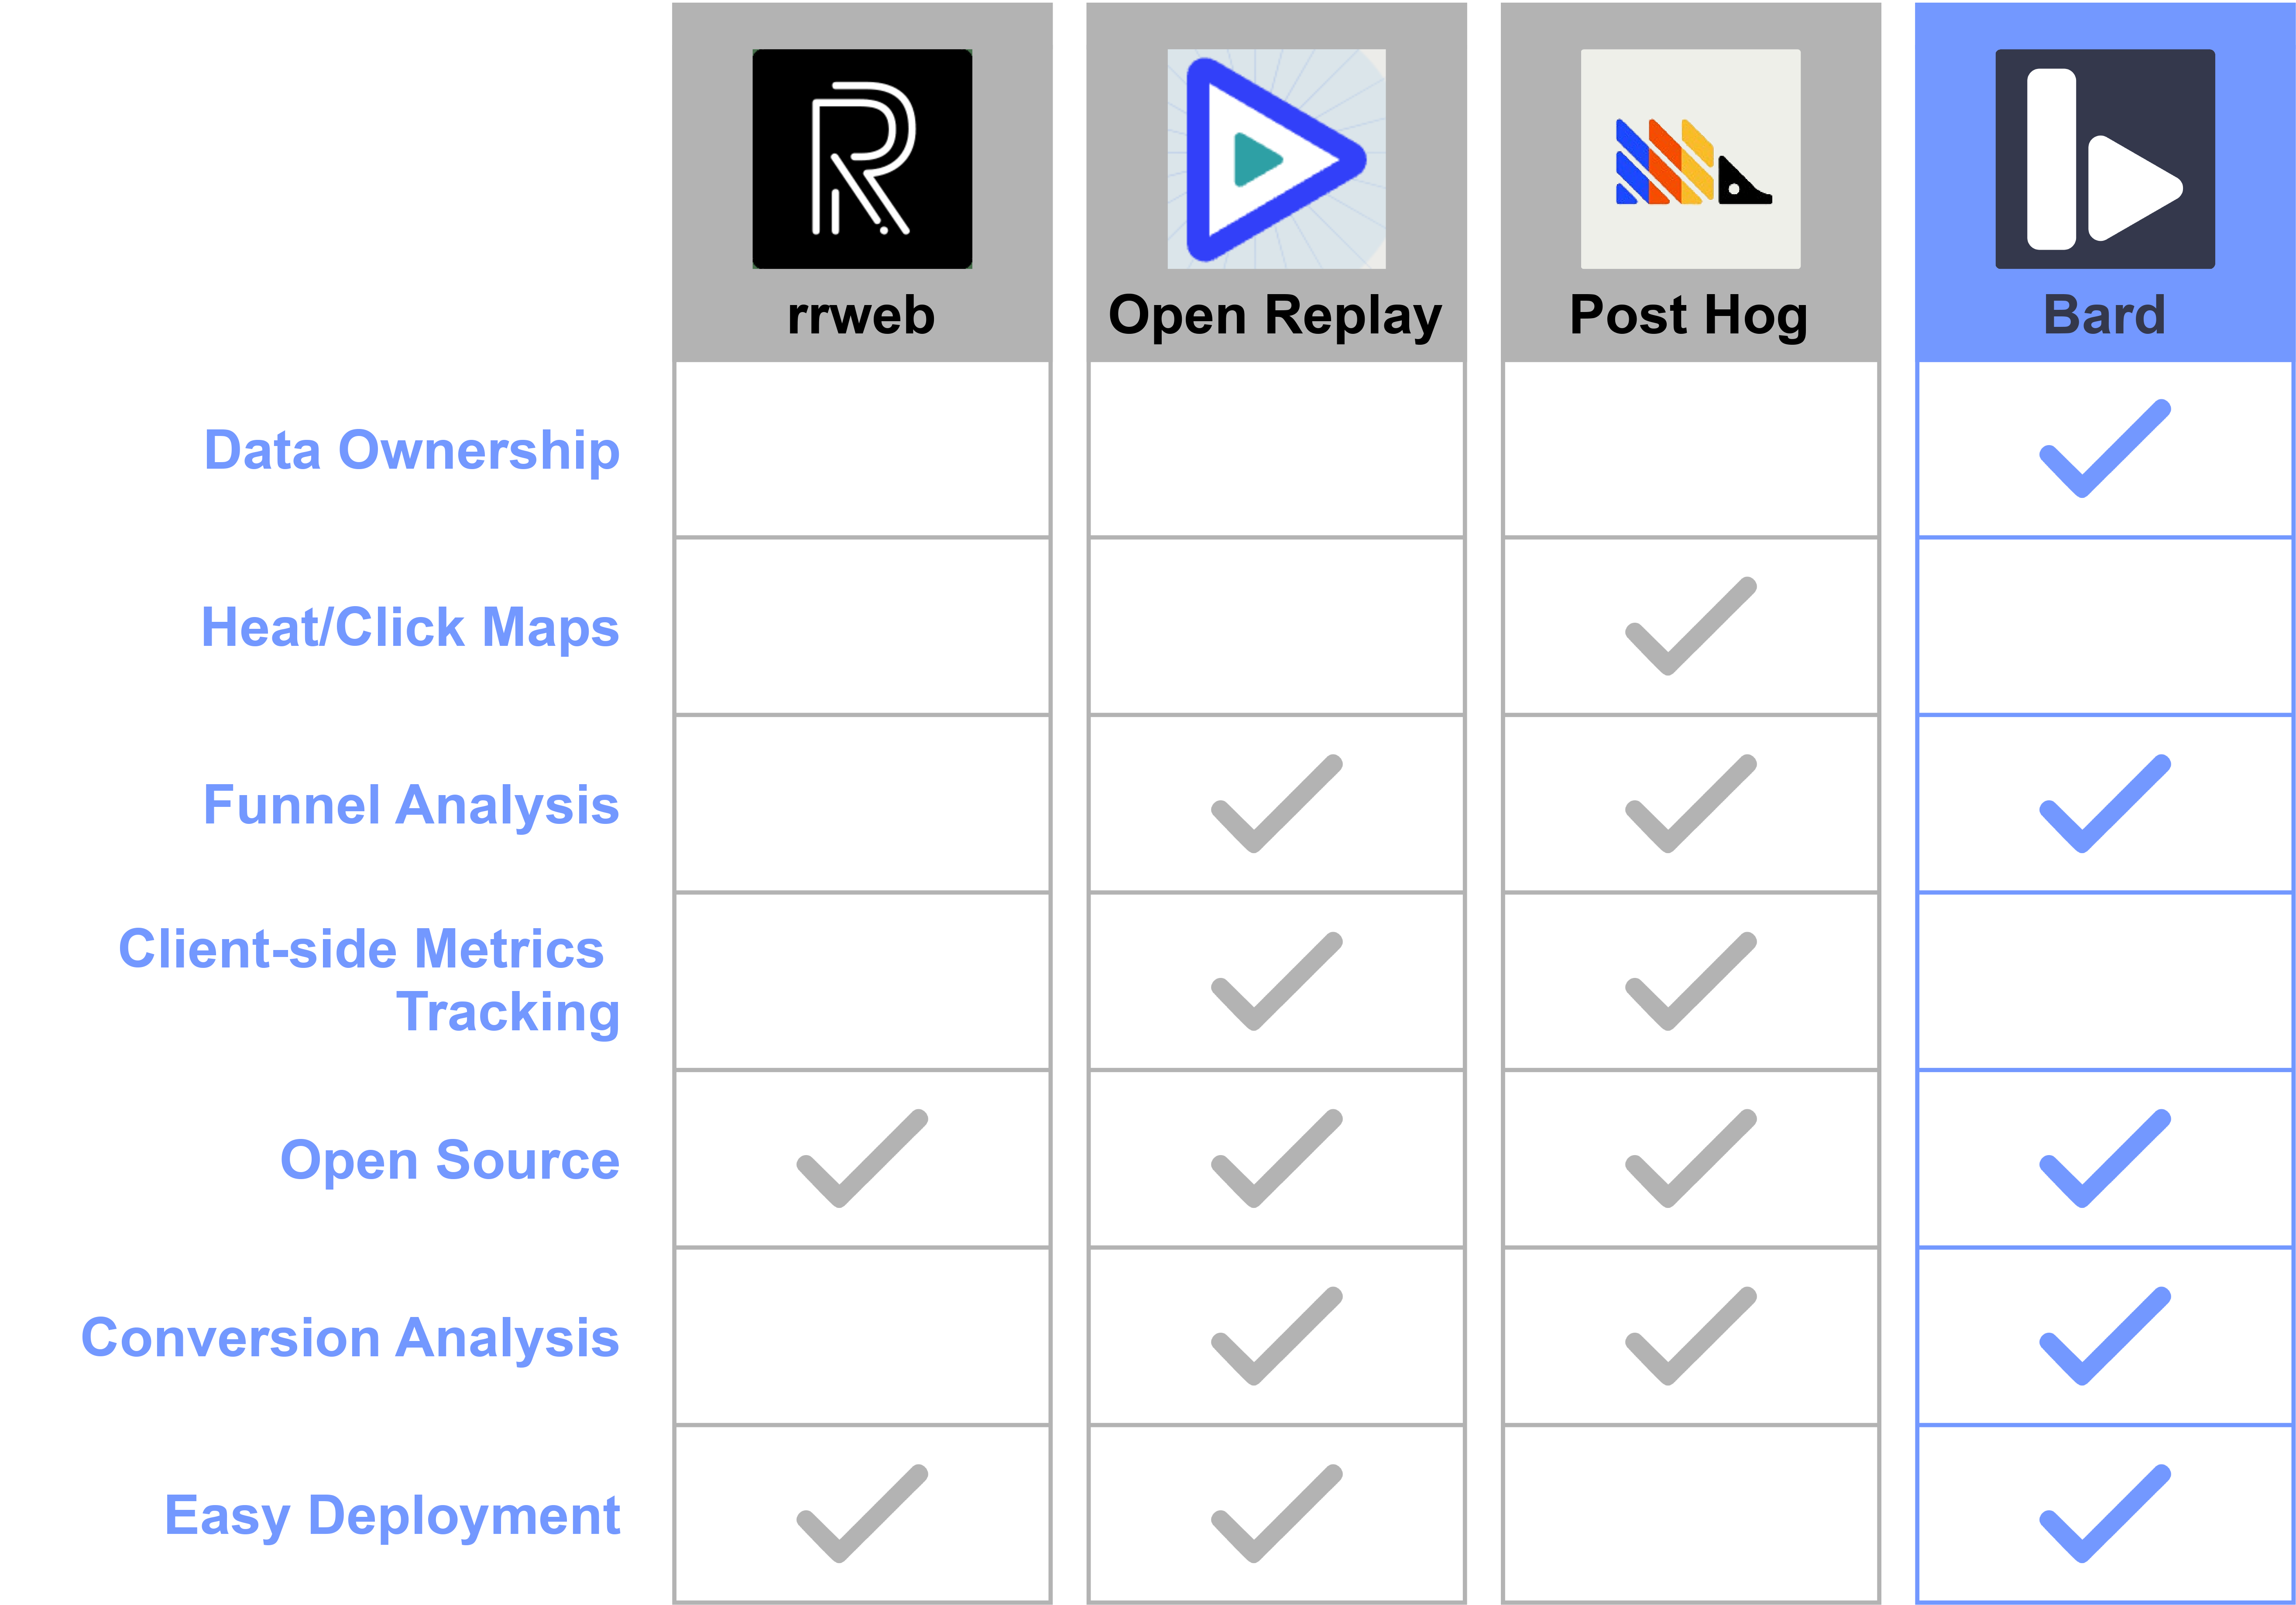
One option is to create a DIY solution by using an open source tool like rrweb. rrweb is a great way to record sessions and replay them, but it's nothing more than a simple recording and replaying engine. It doesn`t come with a backend, so a developer will need to create a data pipeline and storage solution to build any sort of session replay tool. They`d also need to create a UI that would allow them to use the data they`ve collected. This type of solution could take a lot of time and resources that developers of small online applications may not have.
Another option is to use a fully-fledged session replay application like Open Replay or Post Hog. These tools have a variety of features, such as conversion analysis, heat maps, and metric collection. This allows for a lot of flexibility, but it can also be overwhelming; an app developer will need to spend time learning how to use these tools, instead of being able to immediately solve problems. Another downside of using these applications is the loss of data ownership; these large-scale applications are the custodians of the data they collect, which might be a dealbreaker for certain use cases. Furthermore, they are also paid services that might not be affordable for a small company.
An alternative to these approaches is a tool like Bard; an easy-to-use, open-source session replay tool that offers conversion analysis and ownership of data. Bard is designed to be an intuitive session replay tool with a streamlined conversion analysis feature; perfect for any app developer who wants to quickly find out why their users aren`t converting.
2. What is Bard?
Bard is an open-source session replay tool that enables viewing and analyzing user sessions. Application owners can filter a list of recorded sessions, view sessions as if they were videos, and perform conversion analysis using a tool called a funnel.
Replaying Sessions
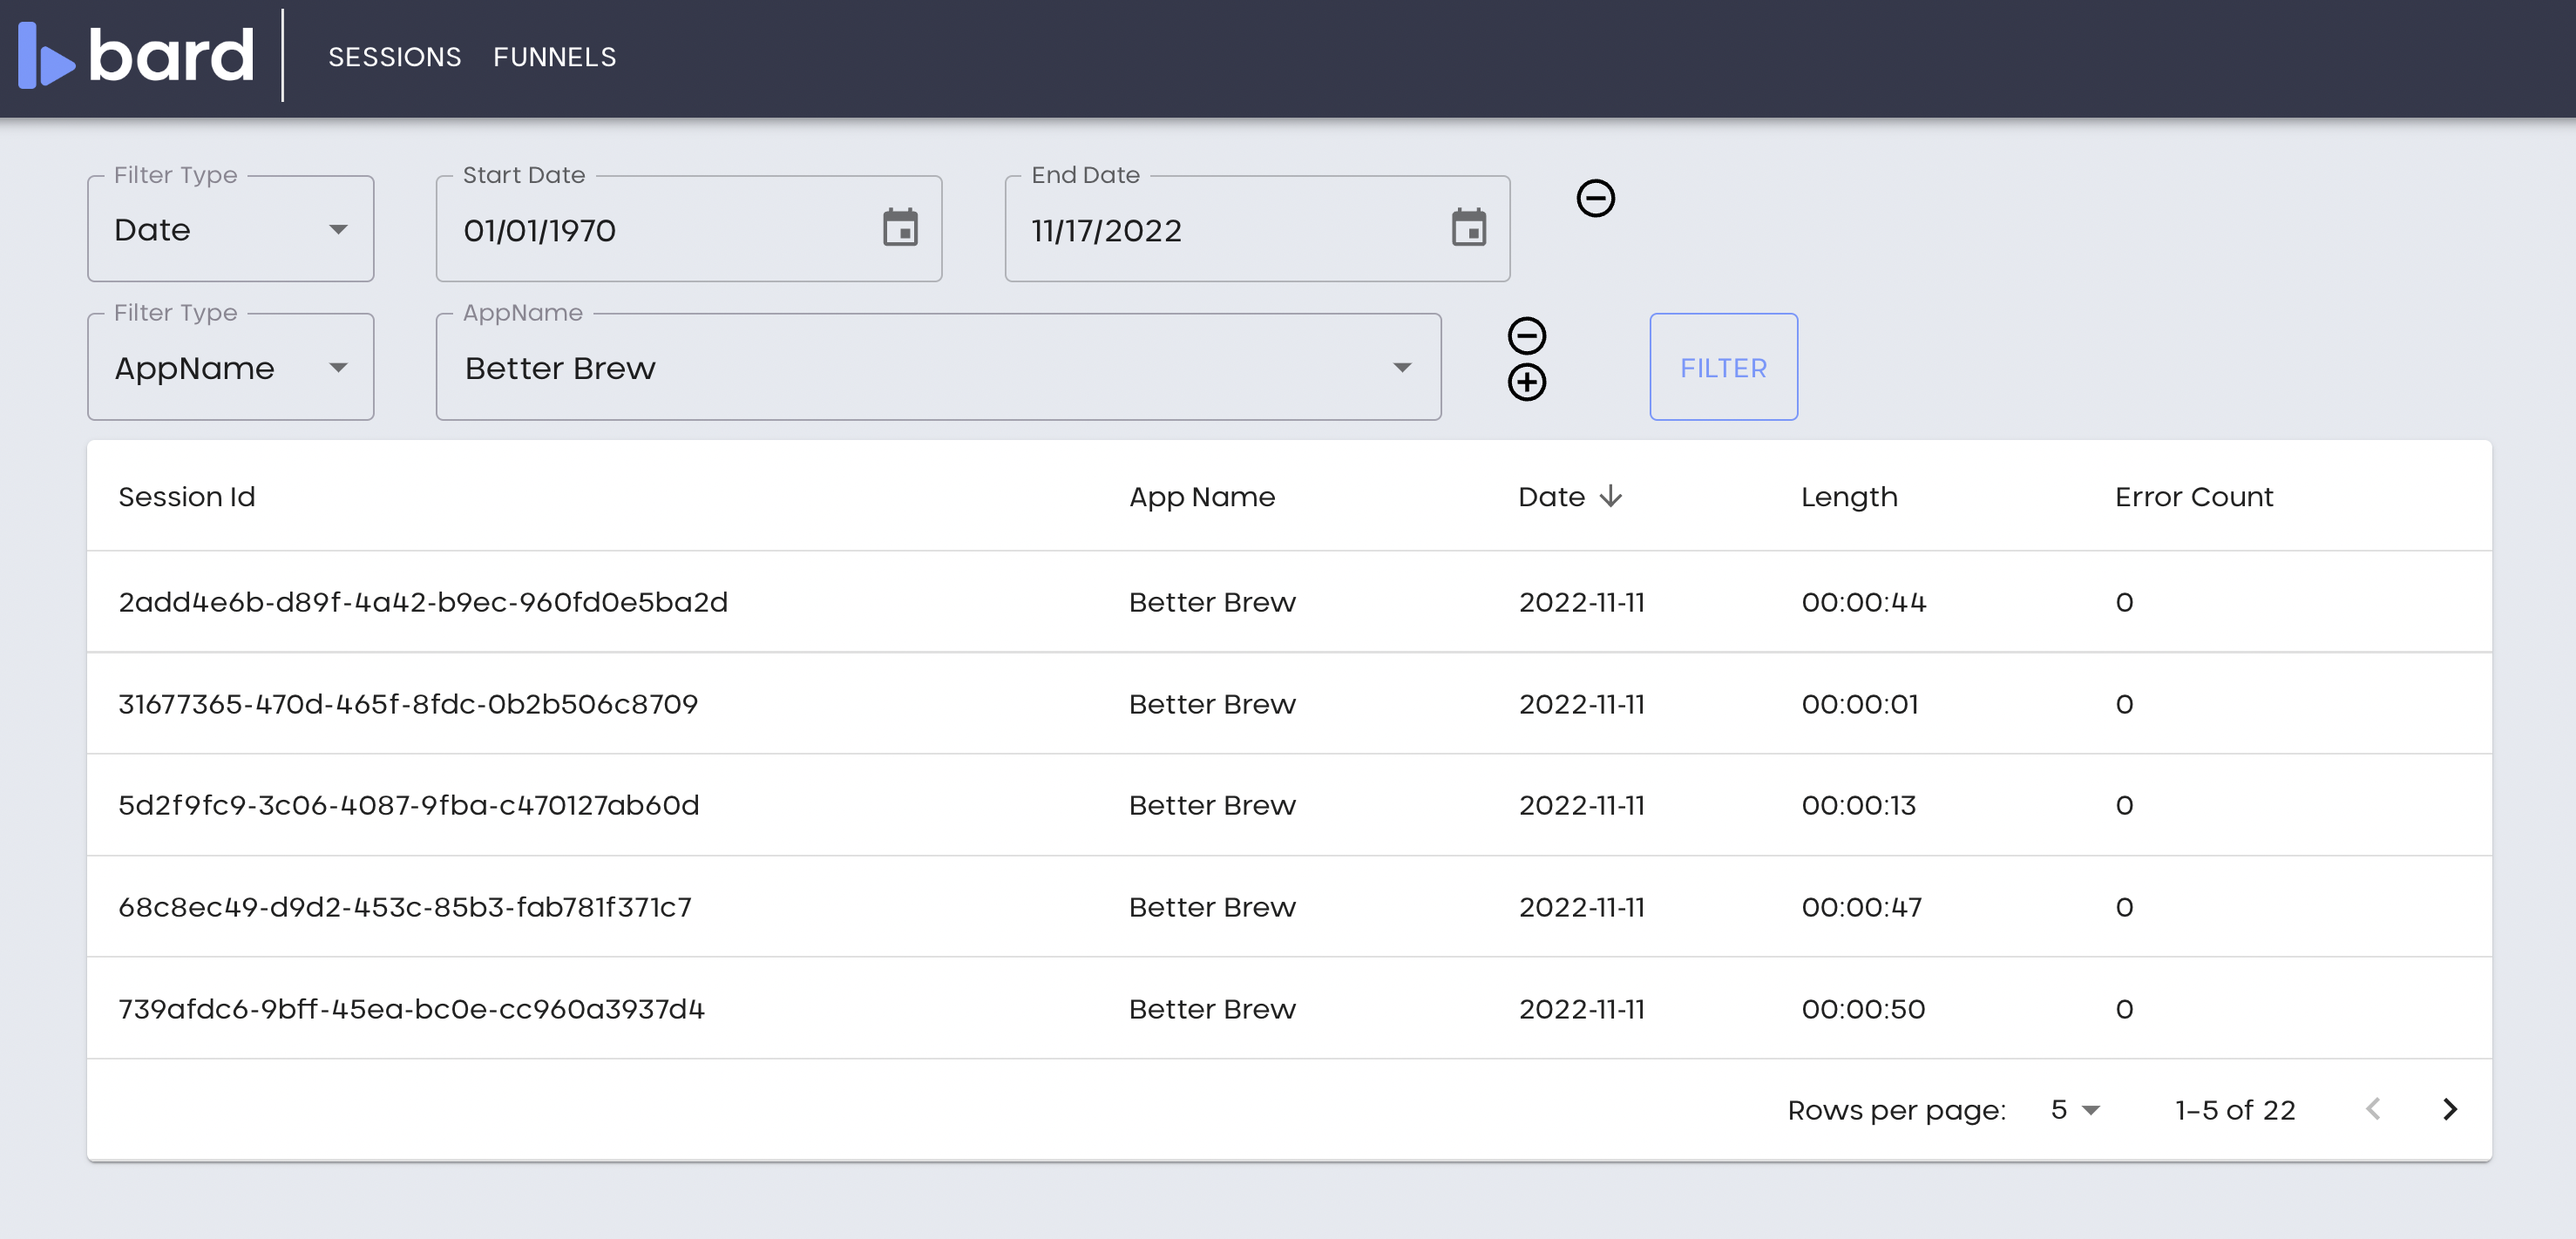
Bard lists available session recordings, which can be filtered by date, duration, application name, and if the session contains errors. Clicking on a session plays that session as if it were a video. On replay, the UI highlights custom events and errors, allowing Bard users to quickly find interesting parts of a session.
Conversion Analysis
What Are Funnels?
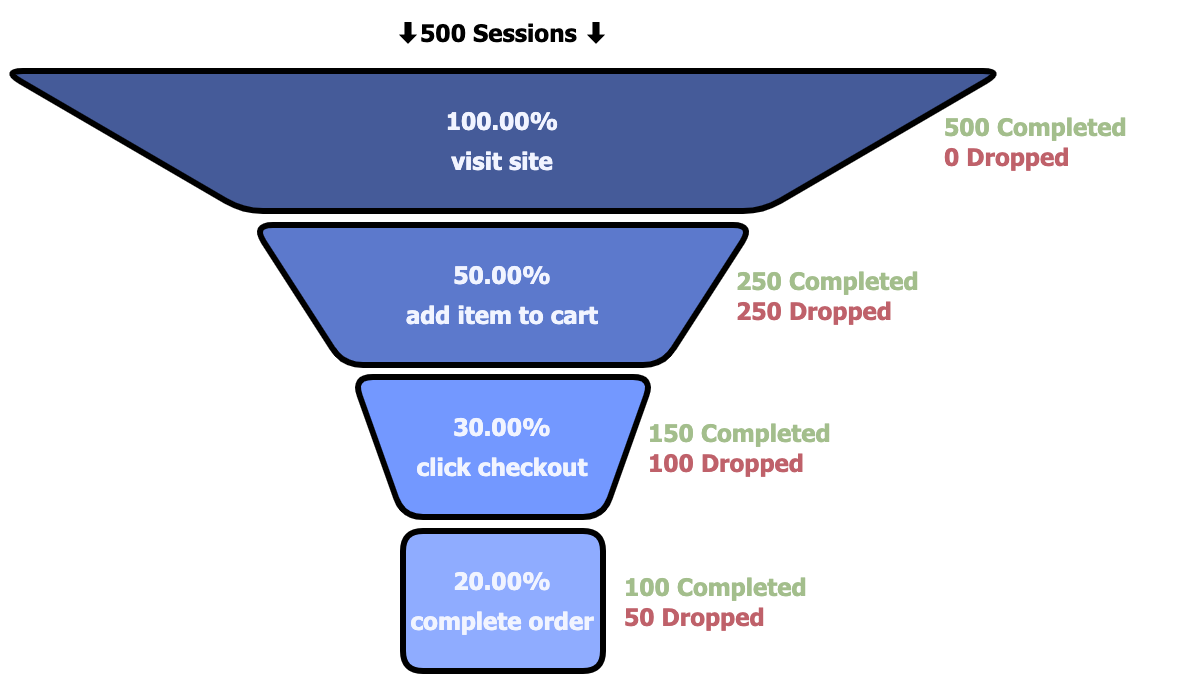
In addition to viewing user sessions, Bard users can perform conversion analysis on recorded sessions using a tool called a funnel. Funnels compare user interactions with a series of predefined steps that define a conversion. They also show how many users completed or failed each step, providing an easy way of identifying pain points in a conversion path. The below figure outlines a hypothetical funnel for a conversion path consisting of a user visiting a site, adding an item to their cart, checking out, and completing their order. 500 sessions enter the funnel, but only 100 of them ultimately convert by following each step and completing an order.
The funnel results give a quick overview of what the trickiest parts of a conversion path are. Bard also allows users to replay the sessions in each step of the funnel, giving context on why users are having trouble. The data from funnel analysis and the qualitative context of session replay enable a developer to make informed improvements to their application.
Creating Funnels
Funnels are created in the Bard user interface and are made up of three components: a name, session filters, and an event sequence. The session filters define the subset of sessions that will be analyzed against the event sequence. For example, Bard users can specify that they only want their funnel to include sessions from an app named “Better Brew”. Once filters are defined, the event sequence outlines the sequential steps that define a conversion path. Sessions will be evaluated against these steps, providing visibility into where users dropped off along the path.
Bard only allows one event type for use in event sequences out of the box: clicks, specifically on a button or an anchor html element. But Bard allows for more complex conversion analysis using custom events. These are events that a Bard user can manually trigger anywhere in their application code by calling a function exposed by Bard. See our Instrumenting Your Application section for details. While making use of this functionality requires some work from the Bard user, the substantial upside is the ability to perform conversion analysis involving events of arbitrary complexity. Custom events could be used to detect user actions like purchasing a product, clicking many times without a response, or submitting a form with errors. Custom events are also highlighted in the replayer UI, giving Bard users a quick way to find the most relevant parts of the sessions they`re viewing.
Viewing Funnels
After creating a funnel, its results are available to view immediately. The results show how many user sessions entered the funnel, how many users completed or dropped at each step, and the completion percentage of each step based on the initial number of sessions. The completed and dropped session counts under each step link to lists of relevant user sessions. These sessions can then be viewed directly from the funnel page.
Conclusion
Bard`s session replay and conversion analysis functionality provide a quick way for application owners to find out how to improve their sites. The next section provides a high-level overview of Bard`s architecture, highlighting the components that make this functionality possible.
3. Architecture
Overview
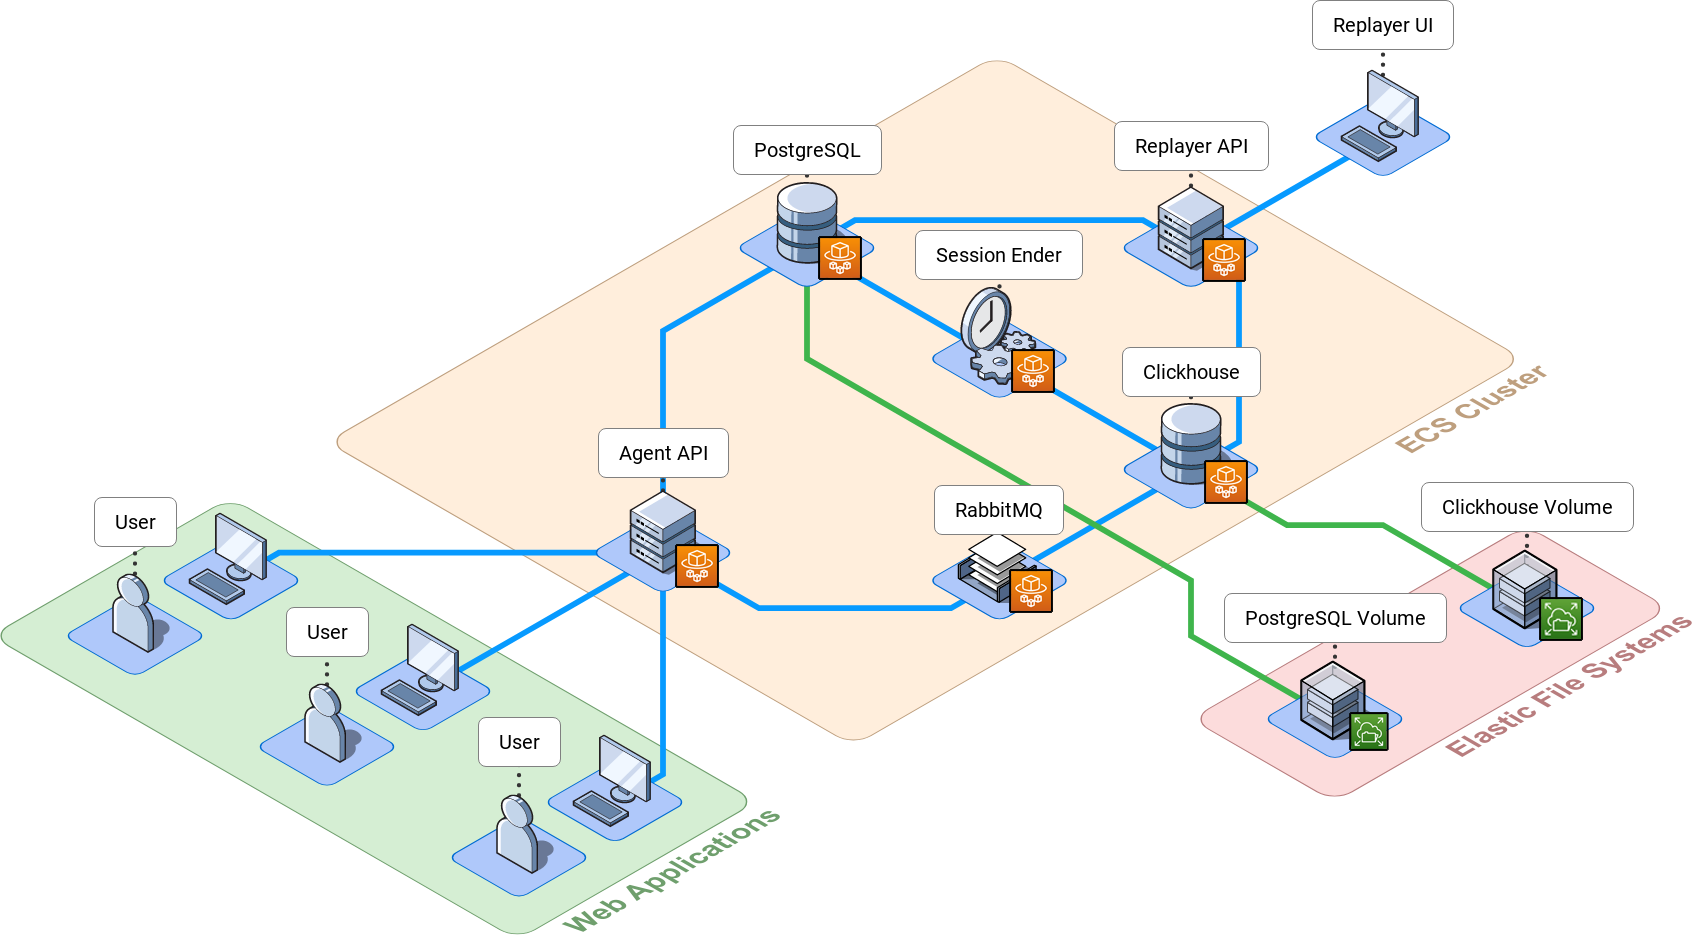
Bard is made up of 8 components that work together for the collection, processing, storage, analysis, and replay of user session data.
Collection
Agent
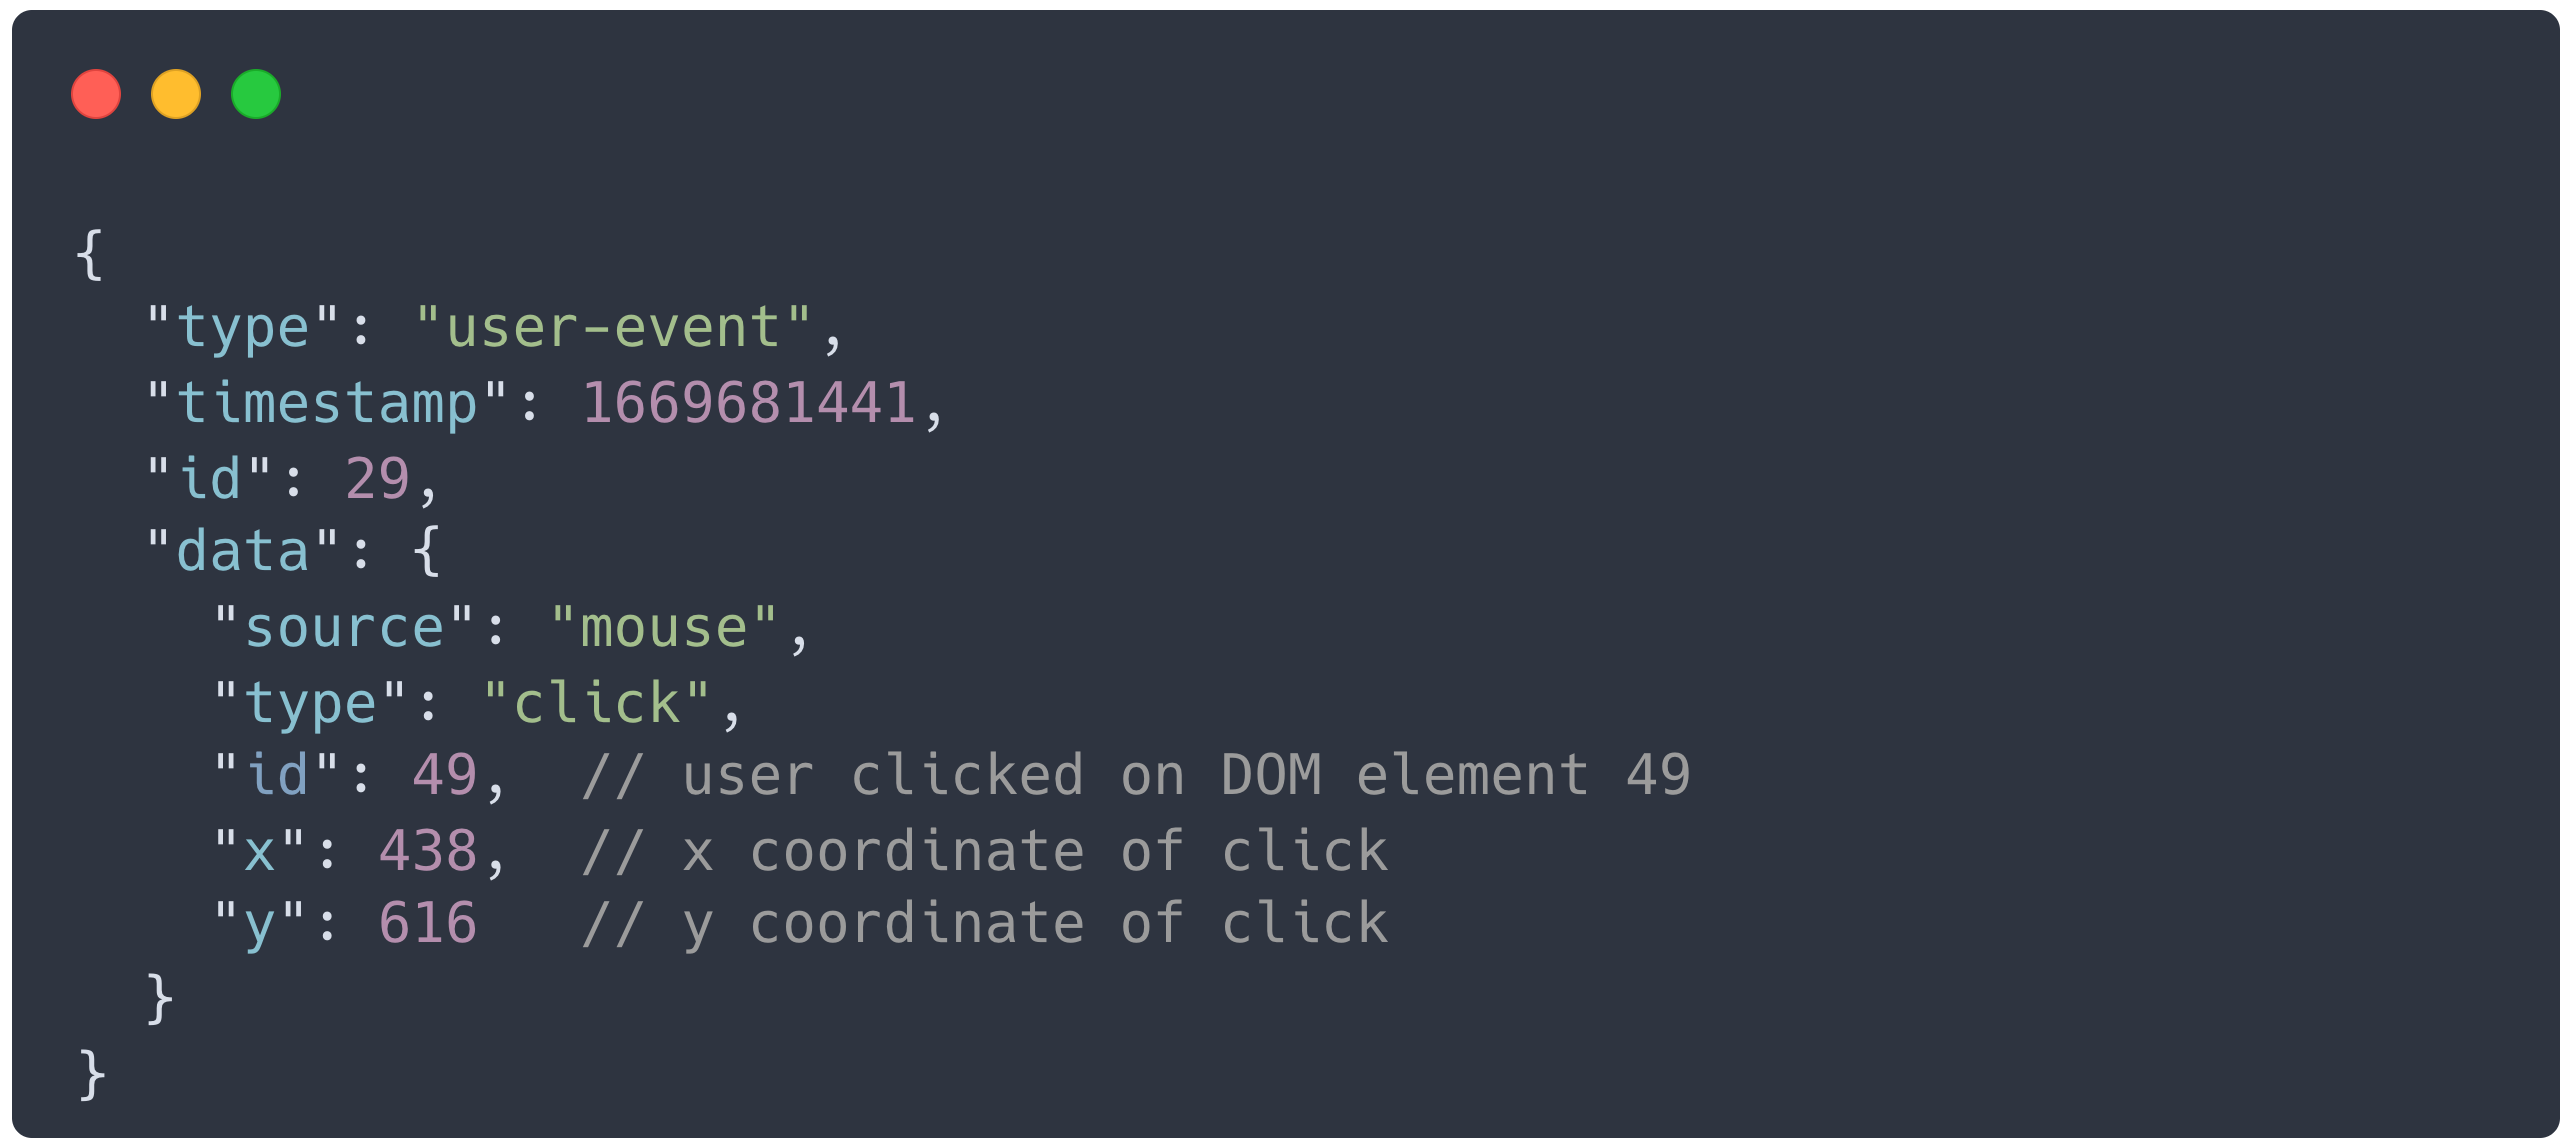
The Agent is an npm package named bardrr, for “bard record and replay”, that's responsible for collecting session data from web applications. Applications with our Agent are called instrumented applications; they use the Agent to record user sessions and send the data to the Bard backend. The Agent uses rrweb as its recording engine, and also sends additional metadata required for conversion analysis. rrweb works by translating each user action into a piece of data that we call an event. An example of an event for a user clicking their mouse is below.
Data Processing & Storage
Agent API
The Agent API efficiently collects and processes the data sent from the Agent, moving it to the appropriate data persistence location. It`s responsible for authenticating the Agent, identifying conversion events, tracking session metadata, and collecting event data from rrweb.
To identify events that can be used in a conversion funnel, the Agent API checks each event it receives to determine if it's a click event or a Bard custom event. Conversion events are saved to our Clickhouse database for later use in conversion analysis.
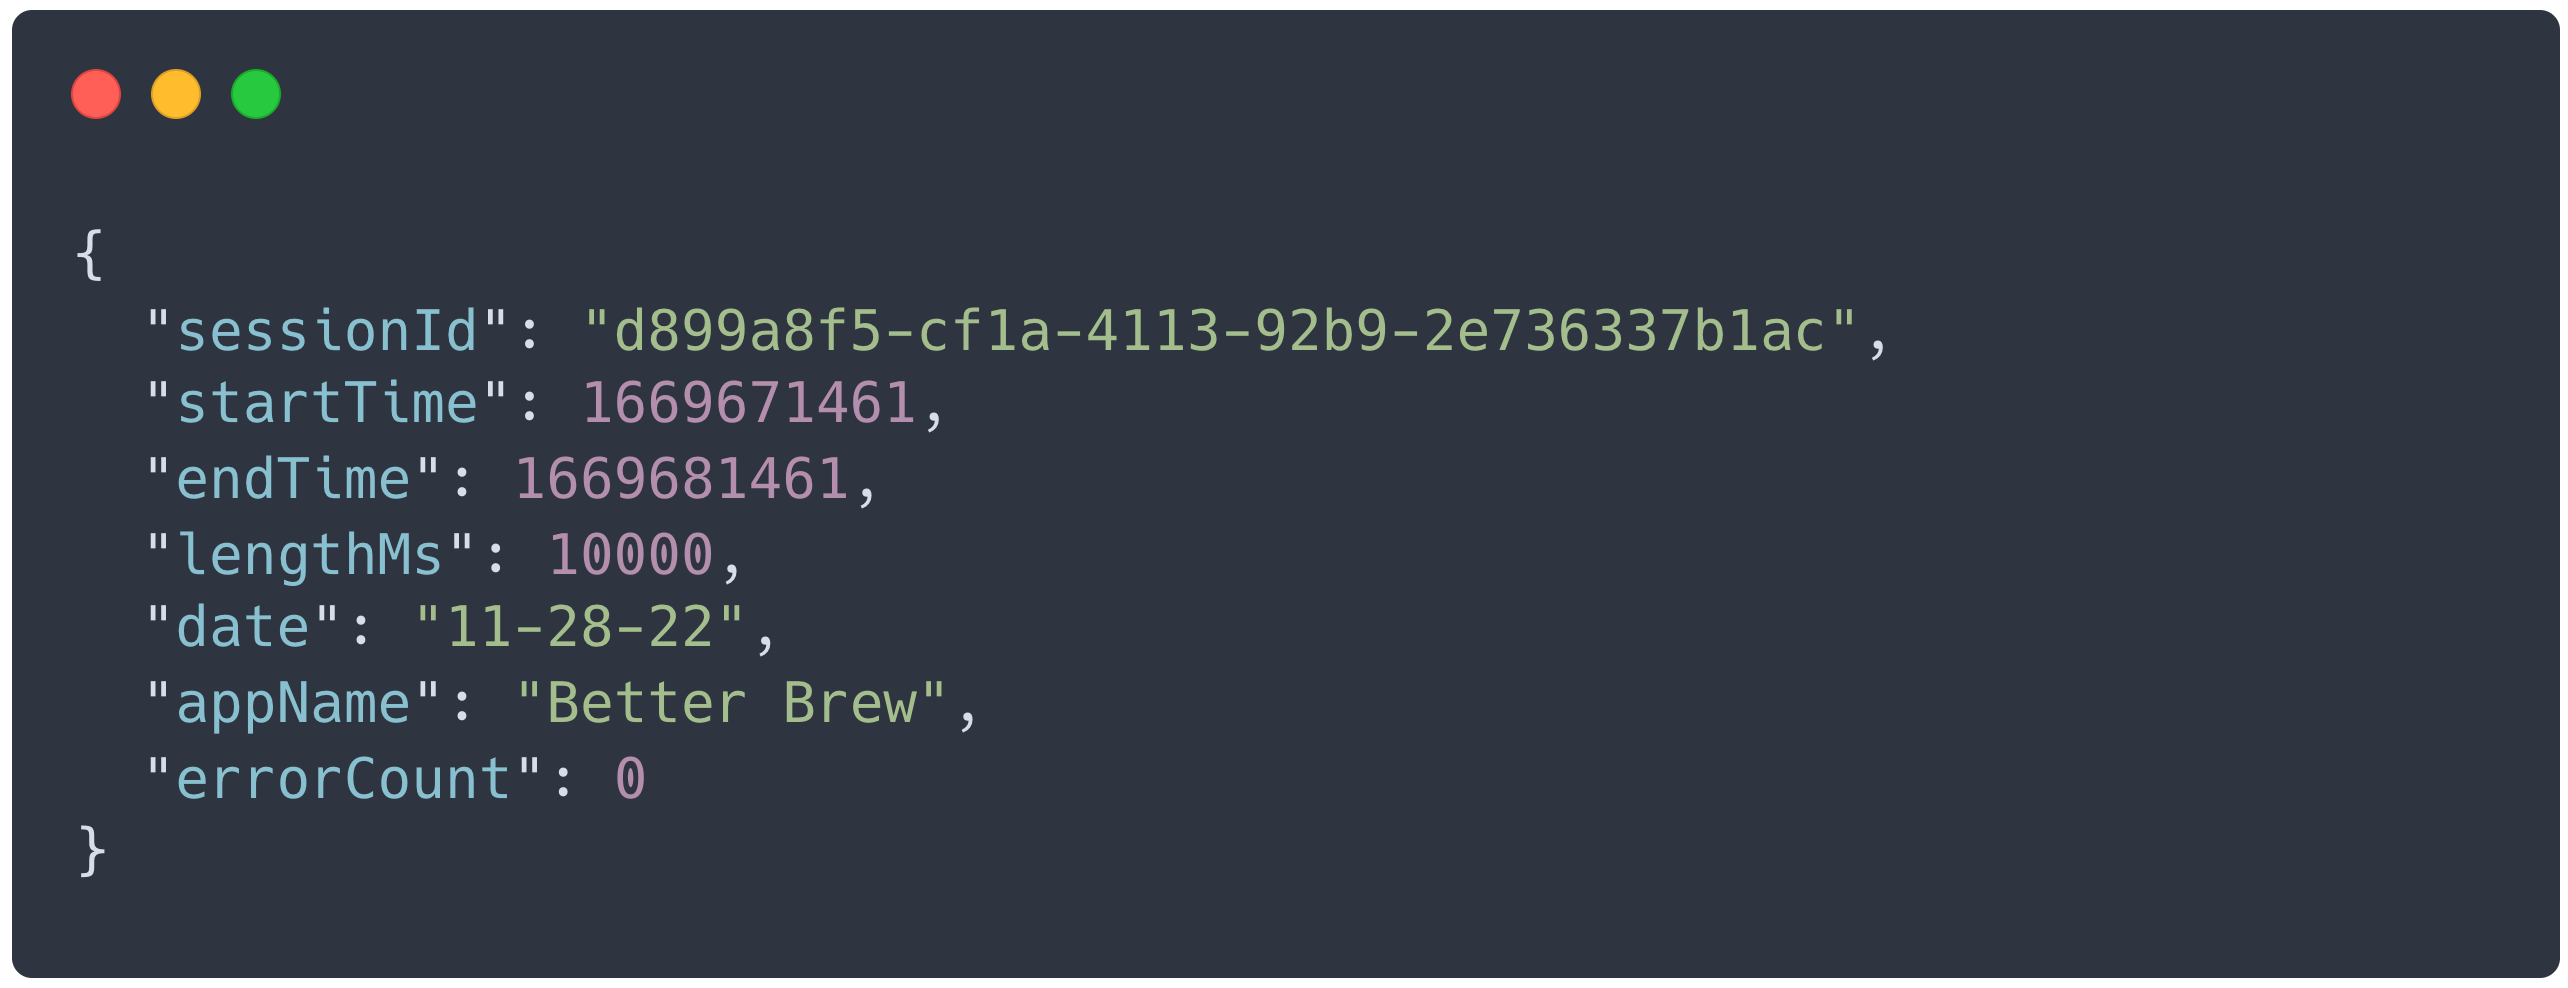
The Agent API also parses session metadata (length, application name, etc.) from the Agent`s incoming event data. This data is then used to create or update session metadata in our PostgreSQL database, which stores active sessions. An example of the session metadata created by the Agent API is below.
The last role of the Agent API is the collecting and forwarding of all of rrweb`s event data. Only a small subset of events from the Agent are used in conversion analysis, but the rest are needed to replay user sessions. This data comes in at a high rate, so the Agent API passes it to our RabbitMQ message queue for processing.
RabbitMQ
RabbitMQ is a message queue that accepts high throughput event data from the Agent API and inserts it into our Clickhouse database. We needed a queue because the amount of data multiple Agents could send to the Agent API could easily overwhelm Clickhouse by itself. Clickhouse isn`t built to handle many simultaneous write operations, but message queues are able to ingest data at a high rate. Clickhouse can integrate with RabbitMQ, allowing it to handle a significantly higher volume of writes.
ClickHouse
The Clickhouse database stores metadata for finalized sessions, conversion events, and all other rrweb events from the Agent. Clickhouse is an analytical database that`s optimized to handle large, complex queries over huge volumes of data; exactly what we needed for conversion analysis. Clickhouse integrates well with RabbitMQ, allowing it to ingest high-volume event data with no issues.
PostgreSQL
PostgreSQL stores metadata for active sessions and funnel data. Clickhouse isn`t optimized for updating existing data, so we couldn`t store active session data or funnel data there because both types of data need to be mutable. A PostgreSQL database was the perfect solution for holding data that could be updated or deleted at any time.
Session Ender
The Session Ender is a cron job script that checks all active sessions in the PostgreSQL database and determines if the session has expired and should be ended. When the Session Ender identifies an expired session, that session`s data is pulled out of the PostgreSQL database and moved into the Clickhouse database. For more information on this process, see our Implementation Challenges section.
Analyze & Replay
Replayer API
The Replayer API connects the Bard UI to the data stored in the Clickhouse and PostgreSQL databases. The API limits the amount of data returned to the Bard UI using pagination and filtering to improve performance.
The API also handles interactions with funnels. It allows Bard users to create, update, and delete their funnels in the PostgreSQL database. The API also performs conversion analysis using the funnels created by Bard users. It queries Clickhouse to find relevant sessions and determines if they succeeded or failed each step in the funnel.
Replayer UI
The Replayer UI displays session data and session replays in an intuitive way. Bard users can filter and sort sessions based on the app name, date, length, and errors. The UI also allows Bard users to define conversion funnels based on clicks and custom events. These funnels can be used to perform conversion analysis on large groups of sessions.
Analyze & Replay
Bard`s components work together to create an easy-to-use application, but our architecture is far from straightforward. Each component has an important role to play, and the next section dives into some of those roles in more detail. It outlines some of the key challenges we faced while designing Bard and demonstrates how our architecture overcomes those challenges.
4. Design Decisions
There were two major engineering problems that informed how our team designed and built Bard. The first was how to record sessions in a way that would make conversion analysis possible. The second was that Bard needed to handle three different kinds of data. Each type of data had unique properties; we needed to account for a mix of mutable data, immutable data, and data coming into the system at a high rate.
Session Recording
The first major problem we needed to solve was how Bard would record user sessions; we could either build our own recording engine or leverage an existing tool. Looking through some open source session replay tools quickly convinced us that developing our own recording engine wasn`t the best option. There were many existing tools we could use for recording sessions, so it didn`t make sense for us to build another. We narrowed down our list of existing tools to three potential candidates: rrweb, OpenReplay and Microsoft Clarity. All three of these tools had recording engines that made them attractive options. They each recorded two things: Document Object Model (DOM) snapshots, and browser events.
The DOM is a representation of a web page as a software object. Developers can write javascript code that detects user actions and changes the DOM in response. This is how developers are able to create dynamic, interactive websites. The DOM also has a hierarchical tree-like structure. Each node in the tree is a piece of a web page. Adding nodes to the DOM adds pieces to the web page; removing nodes from the DOM takes them away.
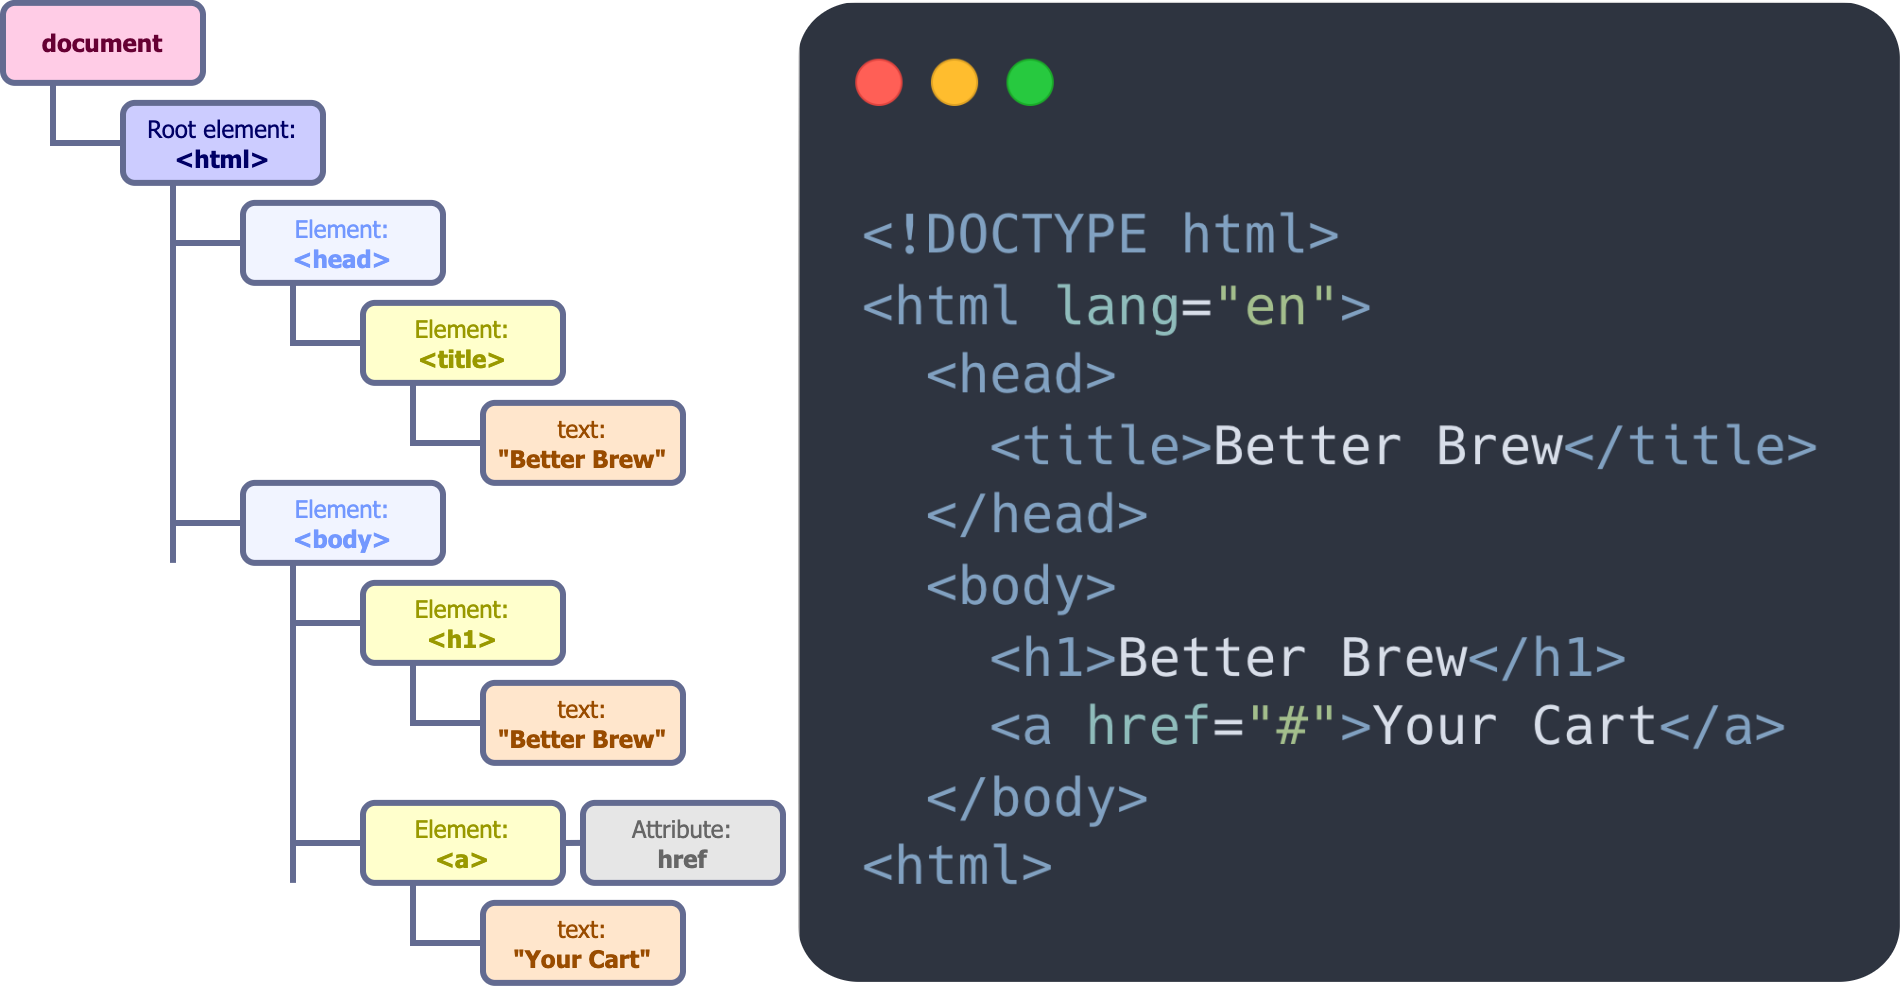
Each of the three session recording tools mentioned above works by tracking the DOM`s structure. The recording engine takes a full snapshot of the DOM tree when the page first loads, and notes DOM changes that occur as a result of user interactions. The engine also records the time of each snapshot and change. When it comes time to replay a user`s session, each tool`s replaying engine uses the recorded DOM snapshots to rebuild the DOM seen by the user. These tools also use the recorded DOM changes to modify the rebuilt DOM in the same way and in the same order that the user experienced.
Each of these tools allowed us to record and replay the visual aspects of user sessions. However, we also needed to record data about what users were doing within an application to perform conversion analysis. Each of the three tools mentioned above provide this functionality by recording browser events. These are signals fired from a web page to the application`s javascript code when a user does something on the page; for example, a ‘click` event is fired any time a user clicks on the page. Each of the three open source tools above also recorded metadata specific to browser events, including timestamps to determine when the browser events occurred. This was exactly what we needed to perform conversion analysis; we could use the metadata to search for different types of events, and the timestamp to ensure the events occurred in a specific sequence.
rrweb, OpenReplay, and Microsoft Clarity all satisfied the basic functional requirements for our session replay framework; we chose rrweb because it was the simplest of the three solutions we considered. rrweb is just a recording engine to track user sessions, and a replayer engine to playback those sessions; there is no backend to store data, and no frontend to organize and analyze that data. In contrast, OpenReplay and Clarity are fully fledged applications, complete with complex architectures and rich feature sets. We wanted Bard to be a simple, intuitive application where users could view sessions and perform conversion analysis; OpenReplay and Clarity have many features outside that scope. Working with one of these more advanced applications would mean isolating the functionality we wanted and cutting out what we didn`t. We wouldn`t have been able to do that without a deep understanding of how these applications worked, a tall task in and of itself. By contrast, rrweb had everything we needed and nothing that we didn`t.
The downside of choosing rrweb was that it didn`t come with an out-of-the-box way to process, save and use the data it generated. While this meant more work for us, we decided the trade-off was worth it because we could devise a design that would be optimal for our use case. Now the only question was what to do with all of rrweb`s data!
Data Ingestion
The second significant challenge that informed our design was data ingestion. We needed to build a system that could handle three different kinds of data corresponding to events, sessions, and funnels. The one common factor between the three data types was that they would be consumed by Bard users. We expected fewer Bard users than instrumented application users, so each data type would have a low amount of reads. However, the similarities ended there; each data type had other unique properties that made handling them challenging. We give an overview of our three data types below.
Event Data
This data would be coming in from rrweb at a tremendously high rate. When a user is active in a rrweb-monitored browser, it's easy for rrweb to record roughly 50 events per second. This means we have a veritable firehose of data coming into Bard; at 200 simultaneous instrumented application users, Bard would need to handle writing upwards of 10k events per second. This kind of data would also be immutable; we`d never need to change a stored event, just query and return it. We expected these queries to be fairly complex though, as conversion analysis would need to include high volumes of event data. Our ideal data storage solution for event data would meet the following requirements:
- Very high amount of immutable writes.
- Low amount of reads.
- Support complex queries over large amounts of data for conversion analysis.
Session Data
Bard also needed to track metadata for each session sent from rrweb, such as the length of the session and the application it came from. This metadata would allow Bard users to filter the sessions they wanted to see during conversion analysis. The central challenge for session data was that it had two states. While a session was active, its metadata could be updated; after a session had ended, the metadata would never change. We needed to design our system such that session metadata could be edited for a short period of time. This kind of data would also be coming in at a much slower rate than our event data; our previous example of 200 simultaneous instrumented users would only create 200 unique sessions, one per user. Our ideal data storage solution for session data would meet the following requirements:
- Low amount of writes.
- Low amount of reads.
- Data is mutable before a session ends and immutable afterward.
Funnel Data
Funnels are how Bard users perform conversion analysis. We wanted Bard users to be able to create, save and update their funnels at any time. This would allow our users to be flexible with funnel creation, iteratively changing parameters until they had exactly what they needed. Since we wanted this flexibility, funnels would always need to be mutable. Our ideal data storage solution for funnel data would meet the following requirements:
- Low amount of writes.
- Low amount of reads.
- Data is always mutable.
The Bard Data Pipeline
Our most complex design decision was how to handle event data. We needed a data storage solution that supported a high rate of writes (up to 10k per second), and could easily run complex queries over a large amount of data. Traditional relational databases were out of the question for this use case. PostgreSQL could support anywhere from a few hundred to 10k+ writes per second, but it required some scaling and configuration to get close to that upper limit. We dismissed traditional relational databases because they couldn`t easily support our throughput needs out of the box. We also quickly decided against a document-oriented NoSQL database like MongoDB. Although MongoDB had a much more attractive baseline write volume of about 15k-20k writes per second, the document data model wasn`t compatible with the kinds of detailed queries we`d want to perform for conversion analysis; MongoDB made storing documents easy, but analyzing the data within them was more difficult.
Time series databases like timescale were initially attractive since they boasted a high write performance of over 1 million writes per second at scale. However, time series databases assume the majority of read queries will be made on the most recently written data. Accordingly, they compress the older data into a more compact format. While this makes for a more efficient use of storage space, it also makes the older data less available and harder to query. This trade-off was unacceptable for us since we wanted Bard users to be able to perform analysis on sessions from any time period, not just the most recent ones.
Finally, we turned to column-oriented noSQL databases because they offered a high rate of writes and supported complex queries. Clickhouse and Cassandra were the two column oriented databases we looked at, but it soon became clear that we weren`t comparing apples to apples. Cassandra is an Online Transactional Processing (OLTP) database. This means that it's built to handle large amounts of transactions (or interactions) with a database; it's optimized for simultaneously doing a large amount (30k - 40k) of small to medium sized queries. By contrast, Clickhouse is an Online Analytical Processing (OLAP) database. This means it's optimized for running complicated queries involving a large amount of data, but it's not great at handling many interactions at once; it can only handle about 100 to 1000 simultaneous queries on a single server. So Cassandra supported lots of writes, but it wasn`t the best at performing large-scale queries. Clickhouse was great at performing large-scale queries, but didn`t support a lot of writes; at least, not out of the box.
Message Queues
Clickhouse has the option of easily integrating with a message queue like RabbitMQ or Kafka. Message queues are tools that excel at handling high throughput streams of data, anywhere from 20k to 1 million messages per second. Applications can package data into a message and drop the message into the queue, which processes the message according to its configuration. In this case, Bard`s Agent API would package the event data from rrweb into queue messages, and the queue would send the event data to Clickhouse. This gave us the best of both worlds; integrating Clickhouse with a message queue gave us the ability to achieve a high write volume, while Clickhouse`s native functionality gave us the tools we needed to run large-scale queries on event data. Knowing that the integration was possible, Clickhouse became our choice for storing event-based data; the only remaining question was which message queue to use.
Clickhouse supported integrations with Kafka and RabbitMQ. The basic functionality of the two tools is similar; applications wrap data into a message, drop the message into the queue, and the queue processes the message. Without scaling, Kafka can handle a baseline of 100k messages per second and RabbitMQ can handle a baseline of 20k messages per second. However, we chose RabbitMQ after considering other trade offs. In short, Kafka came with other features that Bard didn`t need. Kafka is designed to guarantee message ordering, which ensures messages reach their destination in the order they came into the queue. Bard didn`t require this feature because each event from rrweb included a timestamp we could use for ordering. Kafka also serves as a durable message store by default, saving all messages ever received. In contrast, messages read from RabbitMQ disappear and are not saved. RabbitMQ`s behavior suited our use case well because messages read from RabbitMQ would be persisted within Clickhouse; we didn`t need our queue to be the permanent resting place for our event data. Furthermore, RabbitMQ can scale its message throughput to over 1 million messages per second, although it does require more resources to scale than Kafka does. Despite this, RabbitMQ`s baseline of handling 20k events per second was well within our 10k events per second benchmark to support 200 simultaneous instrumented users. We didn`t anticipate the need to scale the queue component of Bard but felt comfortable with having the option if it turned out to be needed. In conclusion, we chose RabbitMQ over Kafka because it's a simple message queue that handled our required volume of data out of the box and had the option of scaling if required.
Mutable Data
Our Clickhouse integration with RabbitMQ solved the largest problem of how to handle the incoming stream of event data from rrweb. However, we could not use Clickhouse to store our mutable data. While Clickhouse is optimized for reads and writes with the help of a message queue, it's not a viable solution for a use case that requires regular updates to existing data. According to Clickhouse`s documentation, queries that update or delete data are “unlike similar queries in OLTP databases… [they`re] heavy operations not designed for frequent use.” Therefore, we needed to store our mutable data for sessions and funnels outside of Clickhouse. We decided to use PostgreSQL, a traditional relational database, for mutable data; both our session and funnel data fit well within a relational model, and we had significantly relaxed throughput demands for these data types. Our funnel data would always live in PostgreSQL because a Bard user could always modify it. In contrast, our session data would live in PostgreSQL while it was active and mutable. When the session ended and became immutable, the session data would be moved into Clickhouse to become eligible for query. For more details on the session ending process, see our Implementation Challenges section.
Conclusion
Handling Bard`s data properly drove some of our biggest design decisions that shaped the application`s final architecture. High throughput event data was processed by RabbitMQ into Clickhouse, creating a data store that could support a high write volume and complex, large-scale reads. However, Clickhouse is optimized for storing immutable data, so we used PostgreSQL to store our mutable funnel and session data. Once a session ends, its metadata is transferred to Clickhouse, where it can be included in queries. The end result is a system that can handle three kinds of data with vastly different characteristics. Along with these high level design decisions that defined Bard`s architecture, we also encountered several challenges while building the system. The next section outlines some of those challenges.
5. Implementation Challenges
Sessions
As stated earlier, a session is a sustained interaction of a user with a web application. While rrweb ably provides us with the individual pieces of a session, it doesn`t offer a way to tie those pieces together into a cohesive, logical whole. As such, the task of grouping disparate rrweb events into sessions was left up to our team.
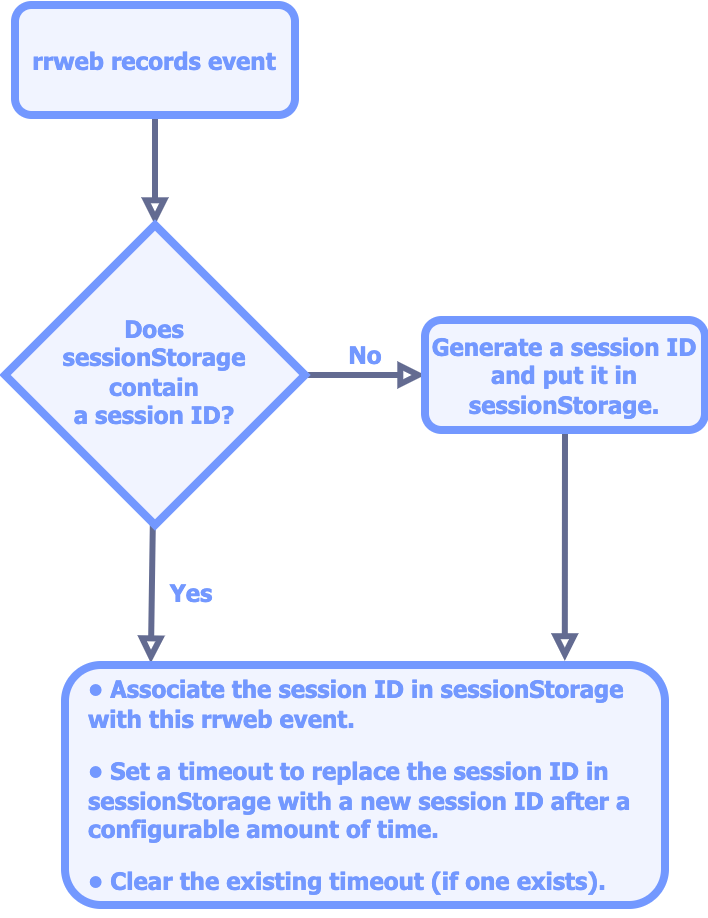
In setting out to accomplish this task, we decided to have the client-side Agent generate and store a unique ID for each session. This ID would be included with every batch of rrweb events sent to the Agent API. The challenge with this approach was persisting a session ID through page reloads and navigation to different pages of the application. Fortunately, the `sessionStorage` mechanism of the Web Storage Browser API presents a nearly ready-made solution to this problem. This mechanism provides a key-value store for a browser tab that persists while the user stays at the same origin (i.e. the same combination of scheme, hostname, and port) and keeps the tab open. By choosing to define our sessions as ending when the user either navigates to a different origin, closes the tab, or does not interact with the application for a configurable amount of time, we were able to generate session IDs as follows:
While this process took care of starting and ending sessions on the client-side Agent, it left the server-side components of Bard with no well-defined way of doing the same. Initially, we considered having the Agent communicate the start and end of a session to our backend by means of explicit HTTP requests, but ultimately rejected the idea; due to the inherent unreliability of the network, we would`ve needed to account for the possibility of either of those two requests not being delivered. We found it easier to create a server-side system for deciding session start and end times independent of the client. The Agent API would define the start of a session as the earliest timestamp of any event associated with that session`s ID. A separate backend component, the Session Ender, would decide when a session should end.
Bard stores active session metadata in a PostgreSQL database and finalized session metadata in a Clickhouse database, so the Session Ender must move expired sessions from one data store to the other. Identifying expired sessions is straightforward, as a session ID is stored in PostgreSQL alongside a maximum idle time and the timestamp of its most recent event; if the session has been idle for longer than its maximum idle time, then it has expired. Moving the expired sessions is more involved; a move consists of transactions on separate data stores, so the atomicity of the move as a whole is not guaranteed. Our implementation does not ensure atomicity but does conduct the move in such a way that there are no adverse consequences if the move isn`t atomic. Expired sessions are moved as follows:
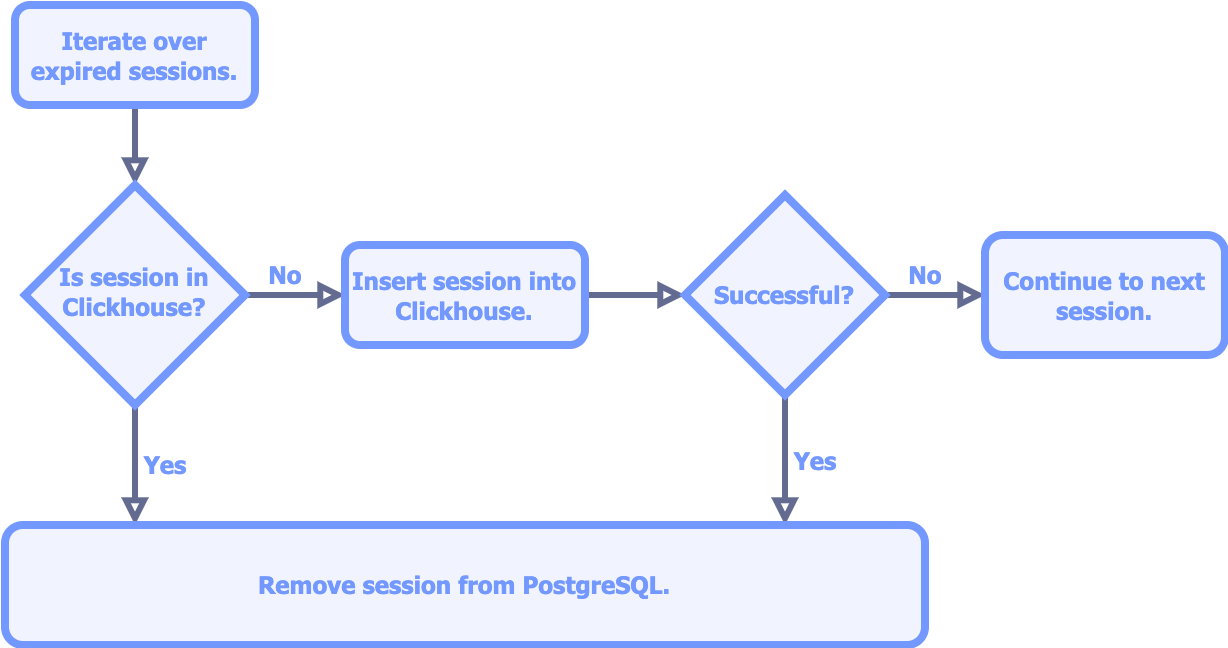
The only way for a move to not be atomic is for the insertion into Clickhouse to be successful and the deletion from PostgreSQL to be unsuccessful; the only side-effect of this scenario is an extra row in PostgreSQL that will be safely eliminated during a future run of the Session Ender.
Funnel Analysis
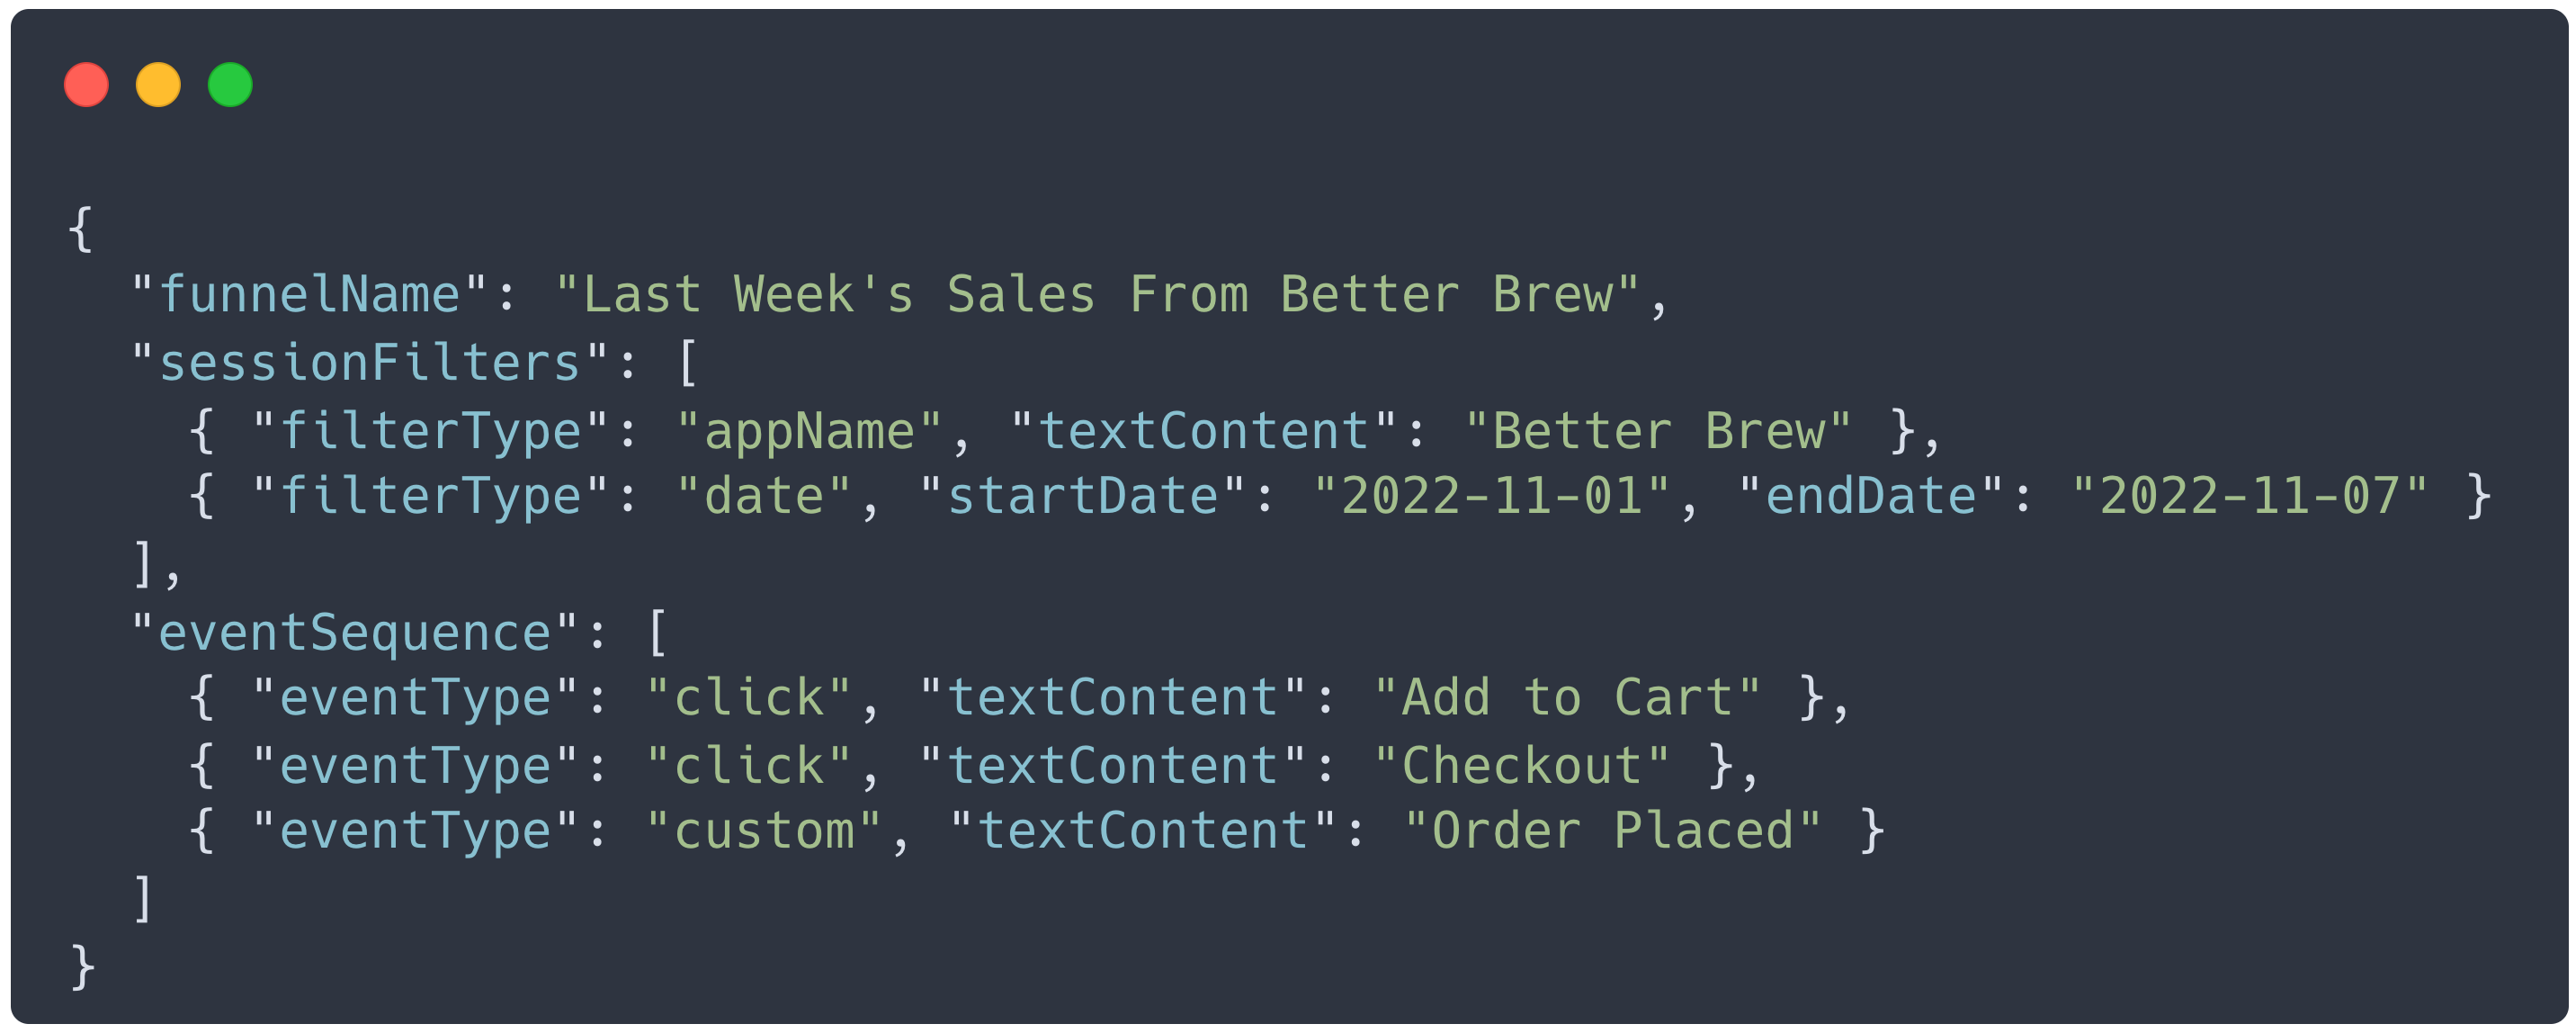
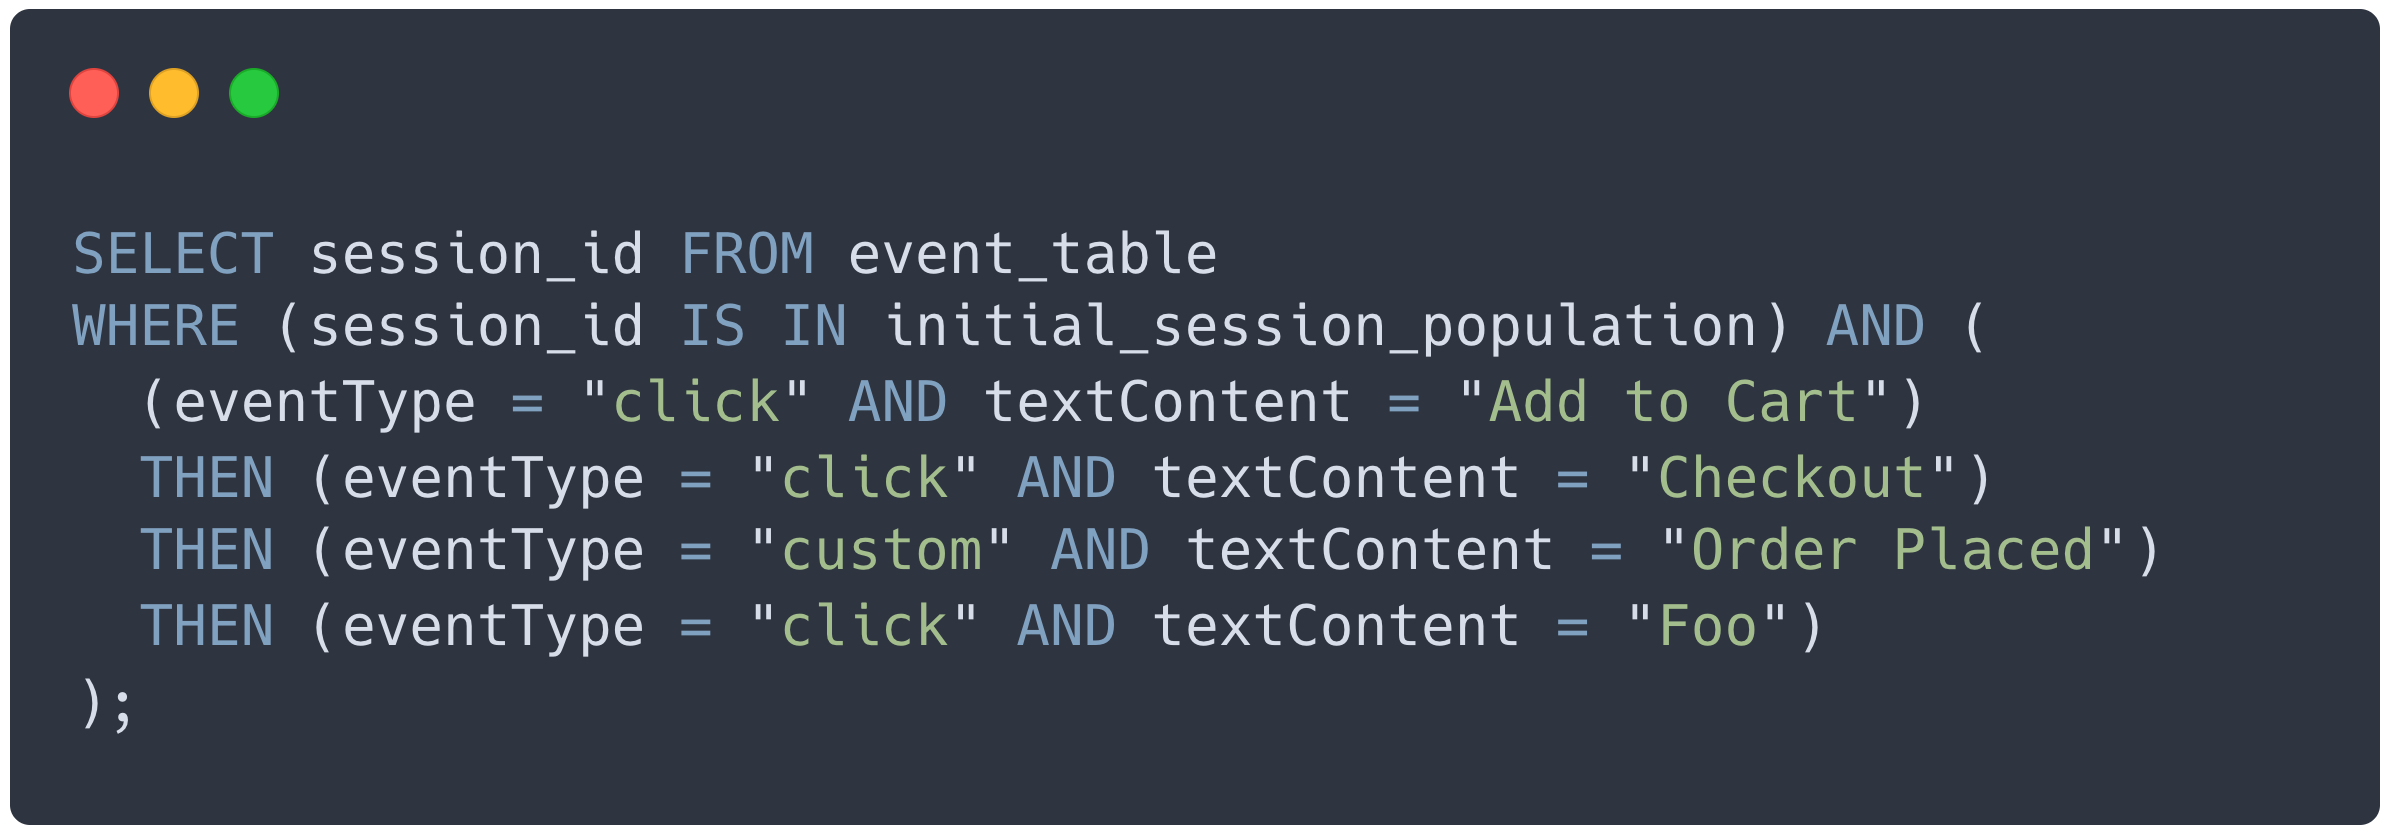
Implementing conversion analysis via user-created funnels was another area with several challenges, the first being the complexity of the funnel itself. As previously mentioned, each Bard funnel has three components: a name, session filters, and an event sequence. The session filter defines what kind of sessions the Bard user is interested in, and the event sequence defines a conversion path by outlining a series of events that occur in a specific order. An example of a Bard funnel`s data structure is below; the session filters dictate that only sessions recorded in the Better Brew app during the week of November 1st, 2022 will be included. Then, the event sequence determines we`re interested in sessions where a user clicked “Add to Cart”, then clicked “Checkout”, then initiated a custom event indicating an order was placed.
It's important to note that there`s no limit to the number of events that a Bard user can include in the event sequence of the funnel; they could also apply multiple session filters. The central challenge in implementing funnels was that Bard needed to be flexible enough to handle any permutation of session filters and event types that a Bard user could come up with.
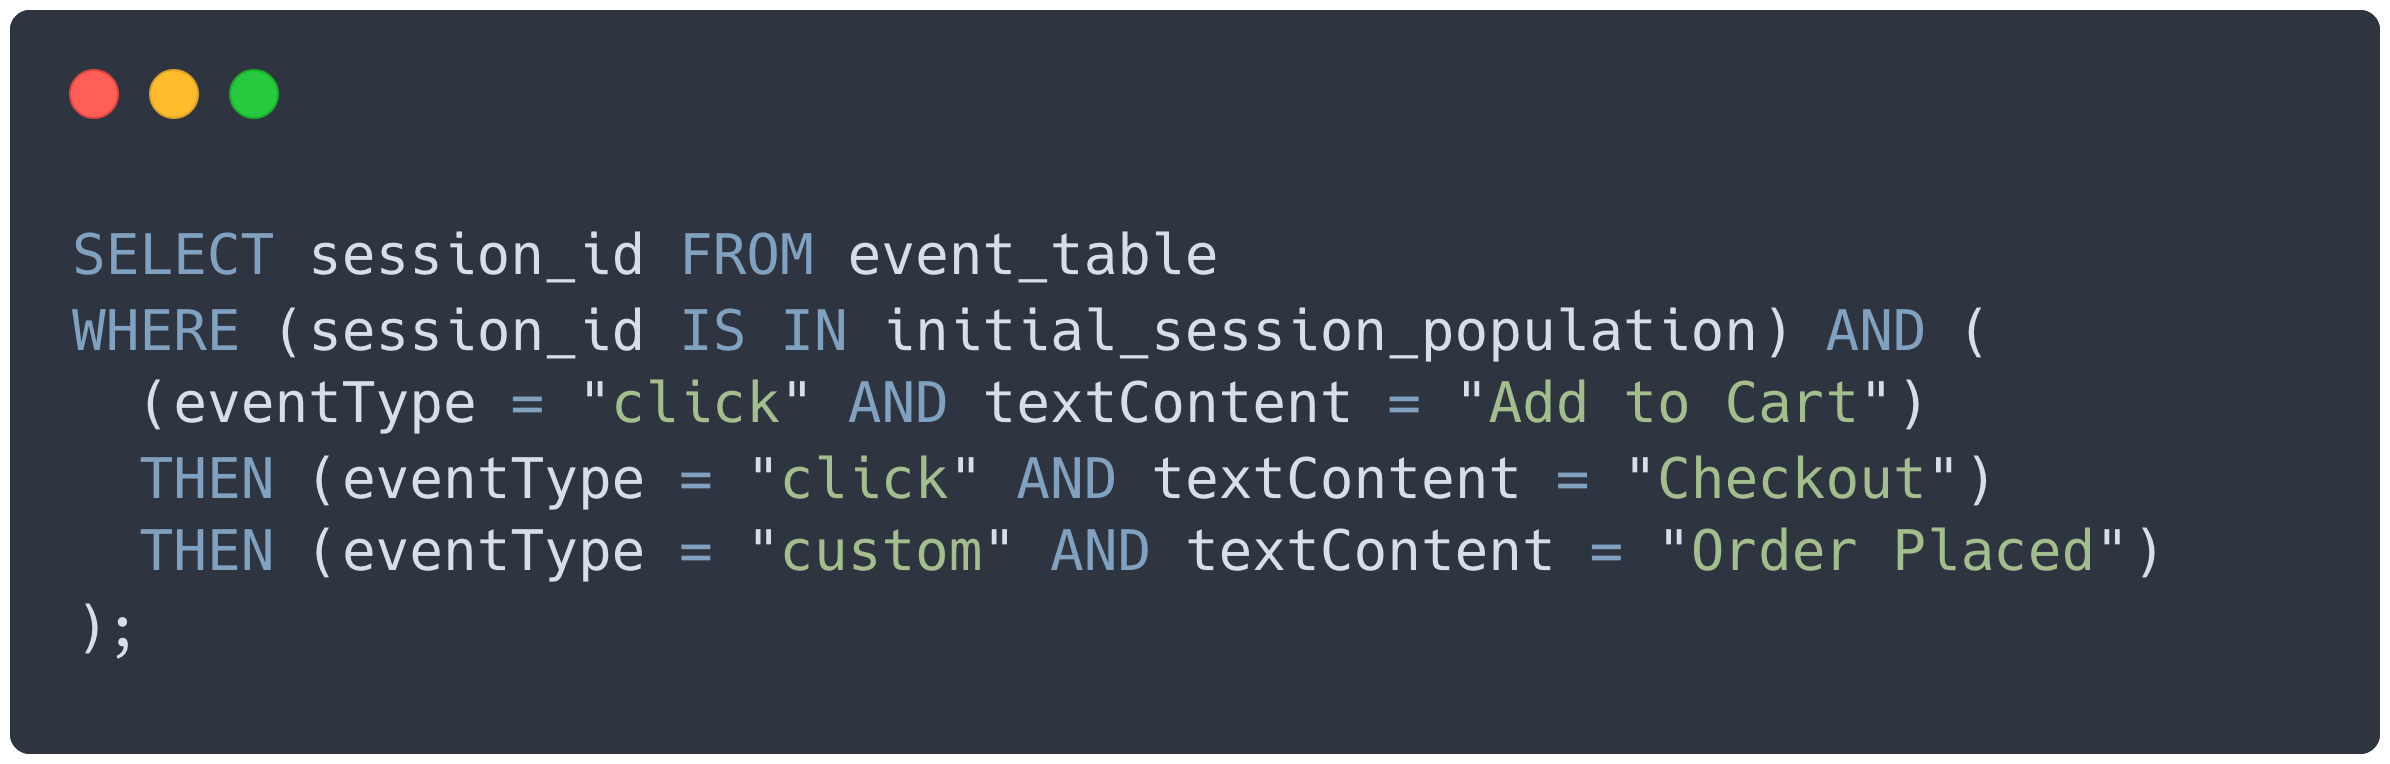
To handle this problem, Bard creates and executes a sequence of queries based on the content of the funnel it receives. After an initial query that obtains the set of filtered sessions, each event in the event sequence is transformed into a query that uses the results of the previous query as its base. For example, a pseudo-query for the event sequence portion of the above funnel might look like this.
Once we had the code to dynamically create these queries based on user input, we could easily handle any funnel a Bard user could create. If a Bard user wanted to add another click event to the example funnel, the pseudo-query for the funnel would change to the following:
SQL Injections
While dynamically creating queries based on user input was great for flexibility, it came with a new problem of its own; creating SQL queries that incorporate user input could allow a malicious user to perform an SQL injection. This is when a user supplies input to the application that is interpreted as a SQL query the developers didn`t intend. For example, a malicious user could create a funnel resulting in the following pseudo-query, dropping a database called `bard`.
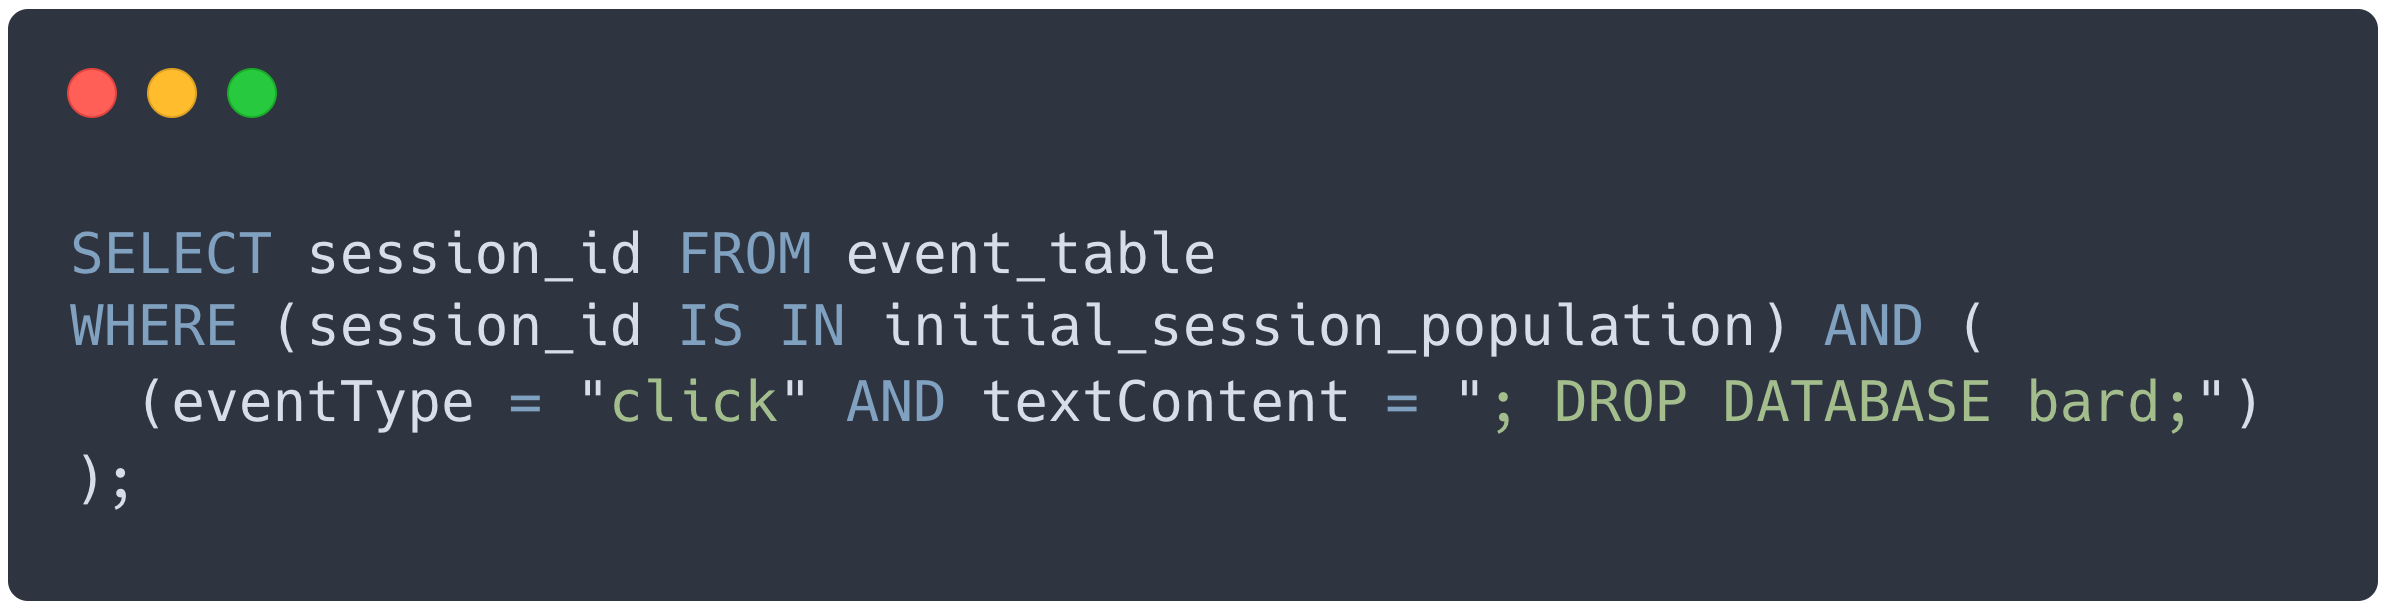
SQL injections are no small problem; OWASP has identified them as one of the top 5 security risks for web applications. Such a vulnerability could allow bad actors to wreak havoc on our database, performing unauthorized reads, writes, and even deletions. Luckily, Clickhouse and PostgreSQL came with sanitization features that allowed us to parametrize our queries as we built them, protecting Bard from SQL injections.
Securing the Agent API
To provide a degree of protection against illegitimate traffic directed at the Agent API, we implemented authentication of requests sent to the Agent API by means of JSON Web Tokens. The Agent API has two endpoints exposed: an ‘authenticate` endpoint and a ‘record` endpoint. When an Agent instance is started, it makes a request to the Agent API`s `authenticate` endpoint; the response contains a signed JSON Web Token. The Agent then includes this token in the headers of all subsequent requests made to the `record` endpoint that handles processing events. The Agent API authenticates all requests made to this endpoint via custom middleware before it takes any other action. In this way, we protect our application from processing illegitimate requests, which at best would waste resources and at worst expose the application to malicious action.
6. Installation & Deployment
Deploying Infrastructure
Bard offers two deployment options: a Docker Compose file and an AWS Script. Docker compose offers a simple, flexible deployment option. Our AWS script is a bit more complex but leverages AWS products to create a more hands-off cloud environment.
Docker Compose
First, clone the Bard deploy repo to the machine you want to deploy Bard to, be it your local device or a virtual machine provided by a cloud service like Digital Ocean or Heroku. The `docker-compose up` command will use the `docker-compose.yml` file to create a network of the containerized applications that make up Bard.
Amazon Script
We also offer a script to deploy Bard to Amazon`s Elastic Container Service (ECS). This service gives developers a way to deploy containerized applications while leveraging the serverless benefits of AWS. Configuration for the AWS script is a bit more involved than the docker-compose option, with a trade-off of easier cloud management. See this README on the Bard deploy repo for details on how to set up and use the script. We`ll summarize the AWS architecture the script creates below.
Elastic File System (EFS)
EFS gives our deployed app persistent data storage that scales automatically. The script creates two EFS instances: one for Clickhouse and one for PostgreSQL. Our containers for Clickhouse and PostgreSQL create volumes mounted to their respective EFS instances. Should a database container or a database container`s host machine crash, our data persists because it's stored on the EFS; subsequent database containers are able to read and write data from their respective EFS volumes, ensuring durable data for our AWS application.
Discovery Service
For readers familiar with Docker, the Amazon Discovery Service is analogous to a Docker Network; it allows the containers within our application to communicate with each other without needing to know the precise IP addresses of the other containers. This is important because if an app component`s container goes down and restarts, its IP address could change. There could also be multiple IP addresses for the same Bard component as more containers are added to scale the application. The Discovery Service keeps track of where each app component lives so the app components themselves don`t have to; without the Discovery Service, our app components wouldn`t know how to communicate with each other.
Elastic Container System (ECS) and Fargate
ECS allows us to deploy containerized applications that leverage Amazon`s serverless cloud and makes it easy to orchestrate containerized applications. For example, a developer can use ECS to ensure there are always a certain number of containers running for a particular app component. The script creates a single ECS cluster and configures it to automatically restart containers if any of them crash, providing high availability to Bard. Then, we use an Amazon service called Fargate to create containers for each of Bard`s components. Fargate creates EC2 servers managed by Amazon. When our containers are created with Fargate, Amazon automatically provisions and maintains the container`s host machines on the cloud; if a Bard container needs more CPUs or more memory, Fargate can scale to provide that automatically. Without Fargate, Bard users would need to manage their own EC2 instances for Bard`s containers, manually checking in on their health and scaling them up or down as required.
Instrumenting Your Application
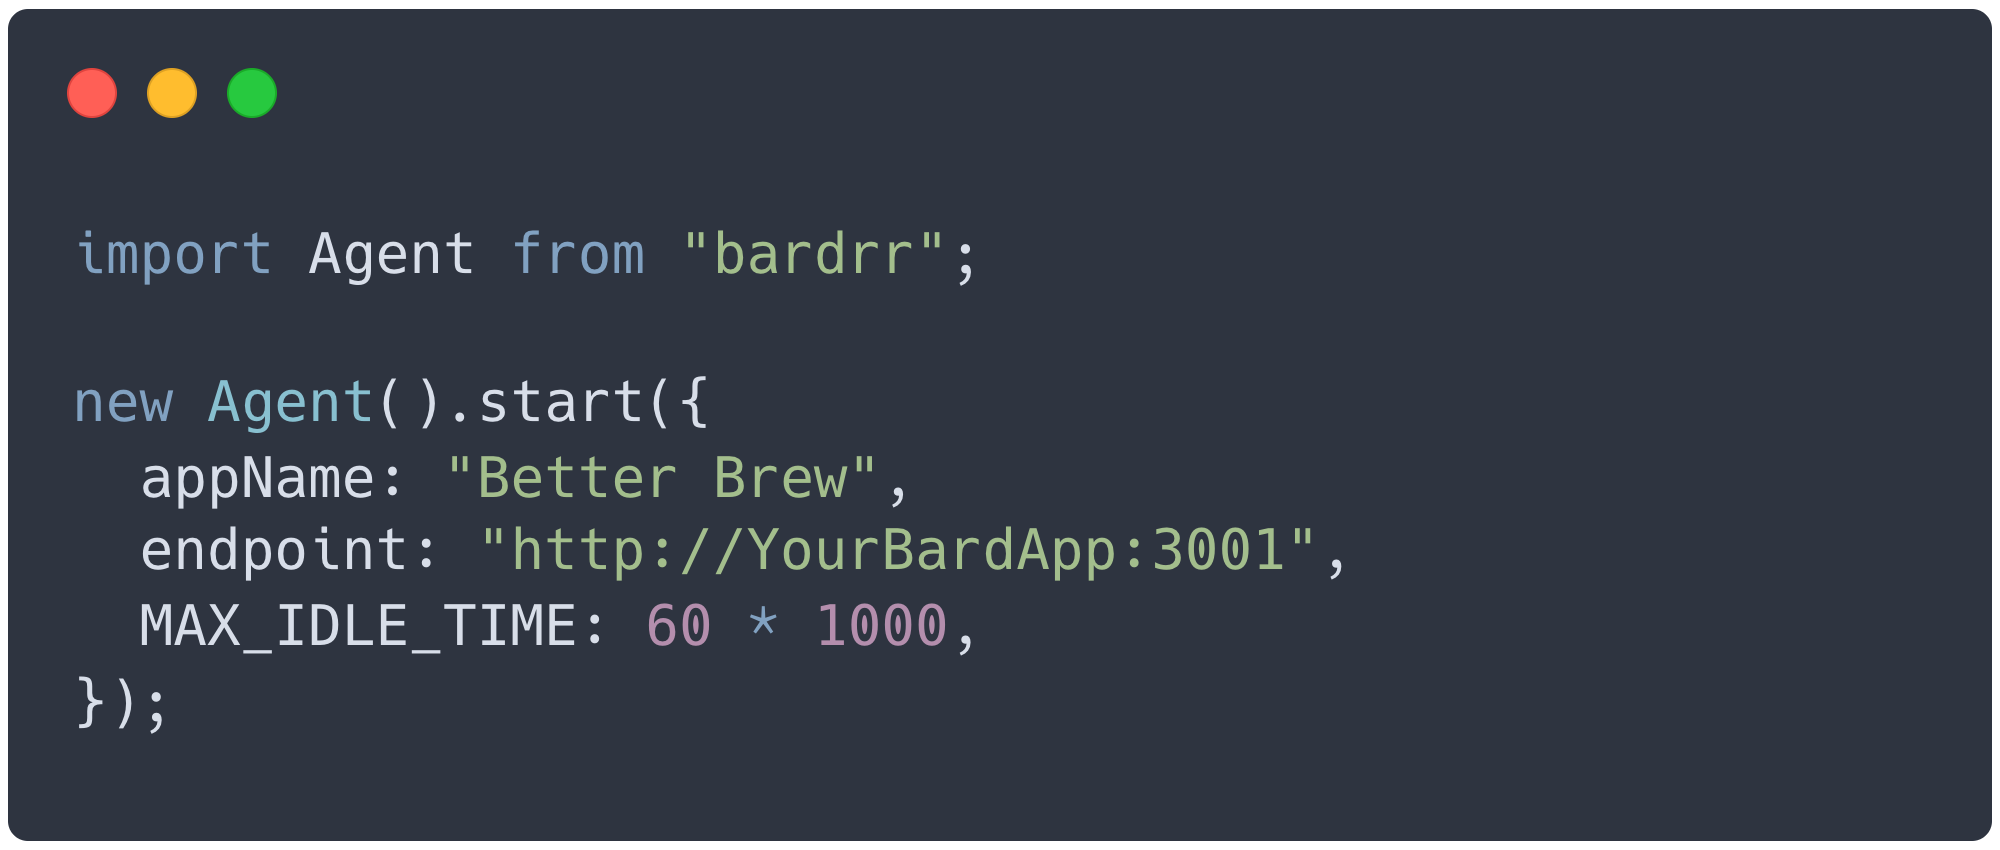
The next step of using Bard is instrumenting an application. This will allow you to record your user`s sessions and receive the data needed for conversion analysis. First, install the `bardrr` npm package as a dependency. Then, in the entry point of your application, import the `Agent` class from `bardrr`, create an `Agent` instance, and invoke its `start` method. The `start` method accepts an object with three properties as an argument.
- `appName`: A string that you can use to distinguish between the different applications that you`ve instrumented with Bard. This value is included in the session metadata.
- `endpoint`: The origin (i.e. scheme, hostname and port) where the Agent API is listening. The Agent API listens on port 3001 by default.
- `MAX_IDLE_TIME`: The amount (in milliseconds) of inactivity after which you want Bard to end a session on the backend.
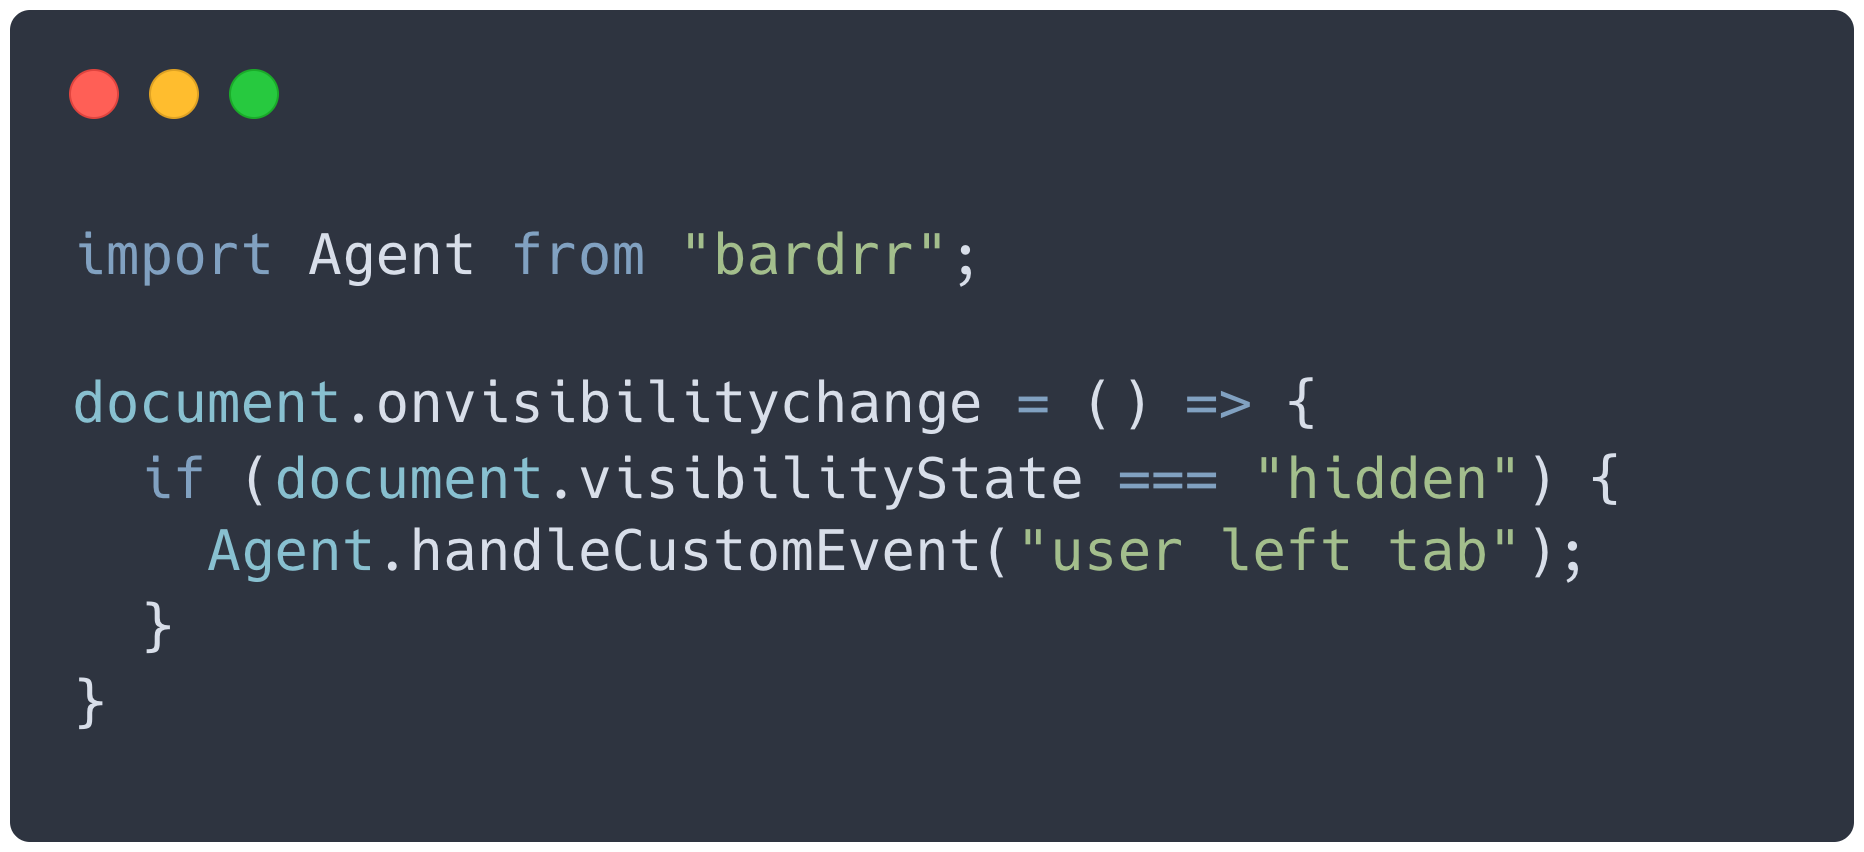
To generate a Bard custom event, use the static `handleCustomEvent` method exposed by the `Agent` class in your application code. When the conditions that define your custom event arise, simply call `Agent.handleCustomEvent` with a string designating the custom event type. In the below example, the Agent will send a “user left tab” custom event to the Agent API when the document`s visibility state is changed to “hidden”.
7. Future Plans
Bard provides a deeper understanding of how users interact with a web application, and we`re proud of what we`ve accomplished. We also realize there`s future work to be done to grow Bard. Here are some possible directions we could take in the future to improve on what we`ve already built.
- Use a webworker to minimize the Agent`s impact on an instrumented application`s javascript thread.
- Add more event types to funnel analysis, such as page visits, network requests and text inputs.
- Analyze for user behavior patterns such as click rage, dead clicks, and mouse rage.
- Use a cache to maintain static assets, like images and stylesheets, during session replay.
Team Bard
Our Hardworking Team
We're a team of fully remote software engineers seeking new opportunities! Feel free to reach out to us if you liked what you saw and want to learn more.

Aaron Hull
Austin, TX
Gene O'Fallon
Tulsa, OK
Marcin Kostecki
Vancouver, BC